1
Introduction
In recent years, the corporate environment has been changing rapidly owing to advances in digitalization, the practical adoption of generative AI, the expansion of sustainability management, and fluctuations in global supply chains. There is a growing need to create new value across business boundaries, particularly for conglomerate-type companies operating across multiple business domains and long-established manufacturers that have accumulated diverse products and technologies over many years.
In addition to strengthening existing businesses and the technologies that support them, it is critical that organizational capabilities reflect changes in the external environment, company-wide assets are reconfigured, and companies are able to expand into new business and application domains.1, 2) In particular, for companies that hold a diverse portfolio of technological knowledge and assets, technological assets should be reorganized at a company-wide level. Considering these issues, Konica Minolta has been continuously working to systematically organize its accumulated technologies and clarify the commonality of technological foundations, sources of strength, and continuity among technologies. One of the core activities underpinning these efforts is the development of technology portfolio visualization strategies.
Companies use technology portfolio visualization methods to organize and understand technology. In practice, this often involves manual organization by technical experts based on technical reports and patent information, which relies heavily on tacit knowledge. Consequently, the visualization methods tend to lack comprehensiveness, objectivity, and continuity, and methods to address these issues have long been proposed.3)
Historically, frameworks for technology portfolio visualization were developed to eliminate expert dependency by hierarchically decomposing complex products into functional units and visualizing them. Representative examples include value engineering (VE) and the function analysis system technique (FAST).4-7) These frameworks can reduce expert dependency in technology portfolio visualization, but not eliminate it entirely. For example, experts who conduct portfolio visualization may possess technical information at different levels of granularity.
Additionally, the output of technology portfolio visualization is enormous. When comprehensively aggregating technology portfolio information for numerous company products and analyzing the technologies for commercial applications, there is often too much information to handle manually. Consequently, achieving comprehensiveness remains a major challenge for researchers.
Therefore, to reduce expert dependency, and enhance the completeness and continuity of visualization compared to conventional, labor-intensive technology portfolio visualization, this study developed and applied a process that combines generative AI-based extraction and structuring of technology information with validation and correction through expert interviews. First, generative AI was used to comprehensively and systematically extract and structure technology information. Then, experts review the output to organize technological assets while minimizing variability in the initial stage of identifying candidate technologies.
Next, through case studies focusing on specific product groups, we qualitatively examined the extent to which the proposed technology portfolio visualization process reduces expert dependency and enhances comprehensiveness. We also discuss the overarching perspective provided by generative AI and the reproducibility of the technology portfolio visualization process, along with method limitations. Furthermore, based on the insights provided by the technology information extracted and structured by generative AI, we discuss the significance of understanding the strengths of technologies and their potential for transfer to other businesses, and of linking these insights to the ideation of new themes.
This foundational study promotes seamless technology management as Konica Minolta continuously expands its application domains and creates new value based on existing technologies. The proposed method is an example of a digital transformation practice in which generative AI is embedded into operational processes to improve productivity and creativity in R&D.
2
Experimental section
This study involved the design of a generative AI-enabled technology portfolio visualization process, which was validated by applying it to the product groups selected within the process. This section describes the four specific steps of the process (Fig. 1).
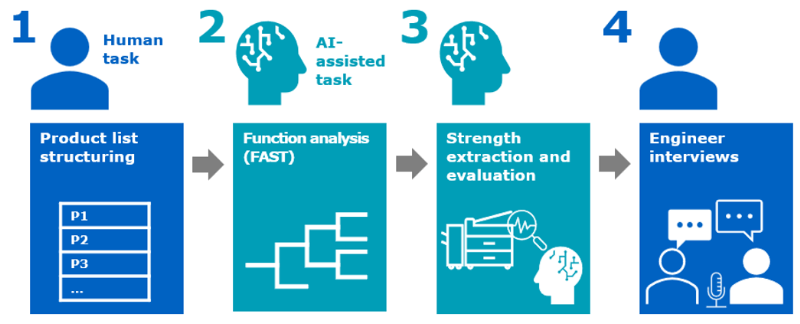
Fig. 1 Schematic of the AI-assisted technology portfolio visualization process.
2-1. Normalization of the Product List
First, product lists were collected from all companies. Then, the granularity of the products and their constituent components were organized, and the targets for technology portfolio visualization were selected.
2-2. Function Analysis using Generative AI
Next, the concepts of VE and FAST were systematically applied to understand the product structures. FAST is a framework that expands functions through means–ends (how–why) relationships and clarifies the logical relationships among functions. Here, a “function” refers to an expression that describes the role of something, typically represented as a noun + verb (e.g., “to △△ ○○”).
The FAST diagram shown in Fig. 2 is a logic tree that hierarchically organizes the product functions. The basic function of the product (F0) is at the top, and the means (how) for achieving this are developed as lower-level functions (F1–F3). Conversely, the purpose (why) for which each lower-level function exists is made explicit by referring to F0. Within the FAST diagram, functions located at the basic function level are referred to as upper-level functions, and the group of functions obtained by subdividing them into means are referred to as lower-level functions.
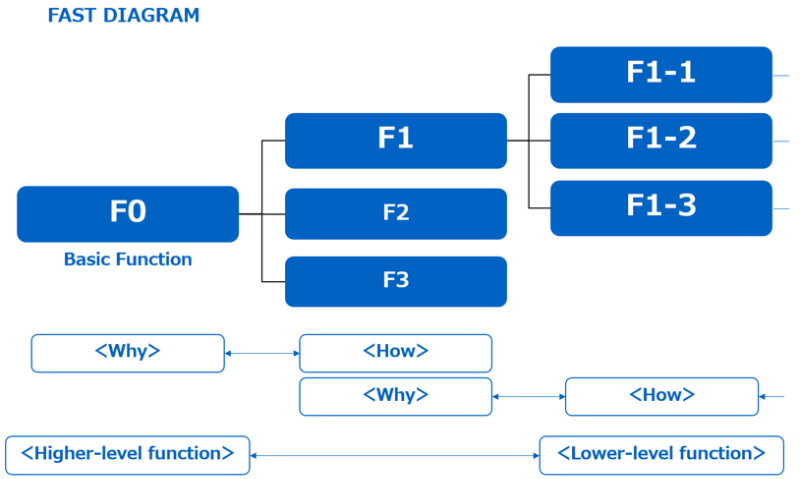
Fig. 2 Diagram of the FAST structure illustrating the relationship among functions in a target product based on the Why–How logic of FAST.
In this study, we created an AI agent (function analysis AI) that uses a large language model (ChatGPT) to generate a function logic tree based on VE and FAST. For the function decomposition AI, prompts were designed such that a component list could be automatically generated by hierarchically decomposing a target product from higher to lower levels, and the functions associated with each hierarchy were automatically extracted. Figure 3 illustrates the hierarchical decomposition of a product into constituent components (C1–C3, Cα–Cγ) and their corresponding functions (F1–F3). Moving from left to right, the granularity becomes finer, and the correspondence between the components and functions is shown on the far right. By organizing components hierarchically from the overall product (P0) down to lower-level structures, the approach clarifies which functions (technologies) are present in the product.
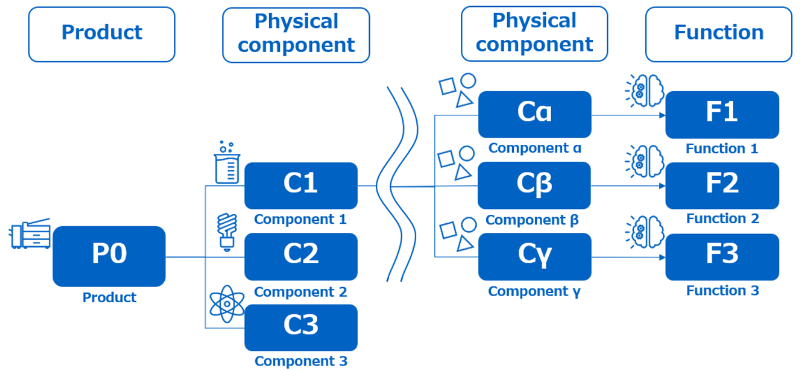
Fig 3. Conceptual diagram of outputs from the function analysis AI.
2-3. Strength Analysis of Technologies
Based on the hierarchical structure described in the previous subsection, a separate strength analysis AI agent was developed using ChatGPT. This agent organizes the technological advantages (strengths) of each component from two perspectives: (1) technologies related to the materials and operating principles of the component or product itself; and (2) process technologies related to the engineers and equipment during the design and manufacturing processes for the component or product. Prompts were tuned to extract the strengths, and their characteristics were described and organized.
2-4. Expert Interviews
Finally, the content extracted by the generative AI was validated and corrected through interviews with development/design personnel and other relevant experts. Through this verification process, we ensured the reliability of the analysis results, while suppressing the influence of AI hallucinations and the inherent dependence of the AI outputs on the model/prompt.
3
Results and discussion
This section describes the results of applying the developed AI-assisted technology portfolio visualization process to products. As described above, after extracting only the product bodies subject to technology portfolio visualization from the company-wide product list, the selected products were decomposed into a hierarchical structure based on VE and FAST. The components and functions were extracted using a functional decomposition AI agent. Next, using the strength analysis AI agent, technological advantages were organized along the two axes of materials and operating principles, and design and manufacturing. The results were validated through expert interviews to complete the technology portfolio visualization.
A photoconductor technology was investigated as a practical verification example. The developed technology portfolio visualization process was applied to systematically organize the technologies embedded in a component by decomposing the product (commercial printing press) to the component level of the photoconductor. The extracted technological information was organized and recorded based on the product category and hierarchical component information. Although some details were omitted, the main hierarchical structure of a commercial printing press is drum unit → photoconductor → coating layer → (UCL/CGL/CTL/OCL). The generative AI automatically extracted the technology, functional role (function), strength, and constraints (limitation) for each layer, and then experts reviewed the outputs to organize them (Fig. 4). Through this procedure, the hierarchical structure of product composition and the corresponding technology/function/strength/constraint information are handled integrally in a common data structure. For the target product group beyond the photoconductor, this establishes a foundation for conducting bird’s-eye technological analyses.
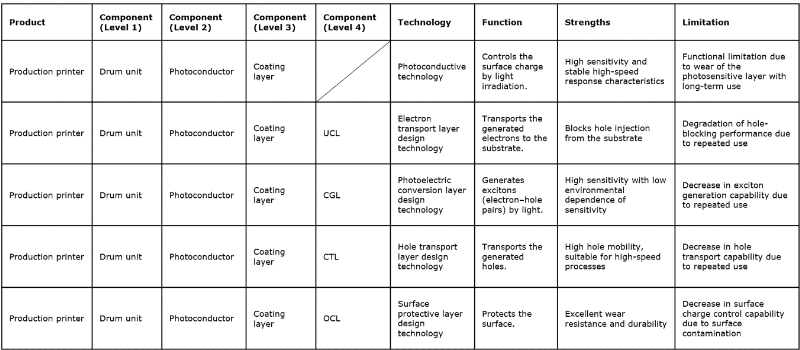
Fig. 4 Example of a data structure of a technology portfolio visualized by the AI-assisted process.
In addition, FAST concepts were incorporated with the generative AI to increase the efficiency of function analysis by replacing the conventional subjective function-extraction process with an automated extraction process based on fixed rules, with the output confirmed and corrected by experts. In other words, the dependence of the overall technology portfolio visualization process on experts was reduced, which is a recognized issue. Moreover, because generative AI collectively generates candidate technology lists and drafts for technology portfolio visualization, the expert workload reduces from the complete enumeration of technologies to just confirmation and correction.
However, even when the same prompt is used, the generative AI output can vary, resulting in limited reproducibility. This study focused on ensuring process-level reproducibility and traceability of the results by fixing the input data, prompts, and procedures, and recording the obtained results as structured data. Nevertheless, these findings indicate remaining challenges associated with the use of generative AI.
Among the technological elements and strengths extracted by generative AI, outputs interpretable as hallucinations were observed, such as specifications that were not adopted and exaggerated expressions. While these were removed and corrected through the expert interview process, it is risky to regard generative AI outputs as correct answers. Therefore, it is important to design operations in which generative AI is a support tool for candidate generation and ideation, while experts make the final judgments.
By understanding the advantages and disadvantages of this method, which combines AI agents with technology portfolio visualization frameworks, such as FAST, we determined that it has the potential to function within Konica Minolta’s technological strategy. The data obtained through technology portfolio visualization are now being applied to enhance our cross-sectional and structured understanding of internal technology assets. By re-evaluating technologies embedded within products at the component level, new technical perspectives beyond existing applications can be obtained. By comparing the re-evaluated technological information across products, it is possible to identify the common foundational technologies that appear across multiple product groups and groups of technologies with similar functions. This helps elucidate the cross-product utilization status and future repurposing potential of specific technologies, which are difficult to visualize by analyzing single products.
For example, it is possible to obtain an overview of the relationship between the evolution of Konica Minolta’s core technologies and business expansion. Insights obtained by the technology portfolio visualization process were discussed in the “Lineage of Technologies” section of the 2025 Konica Minolta Integrated Report (Fig. 5). The technology portfolio visualization process developed in this study provides useful product information at the component level for understanding the history of technology applications at Konica Minolta in chronological order. By organizing and comparing the technology information extracted from products at the component level, five common technologies were identified across multiple product groups: film making and coating technologies, optical design technology, functional organic material design technology, nano-fabrication technology, and polishing technology. All of these process technologies were developed from Konica Minolta’s two founding businesses: photographic film and cameras. Among them, film-making and coating technologies are the most widely used and represent technologies that have deepened while expanding their application domain in line with business transitions.
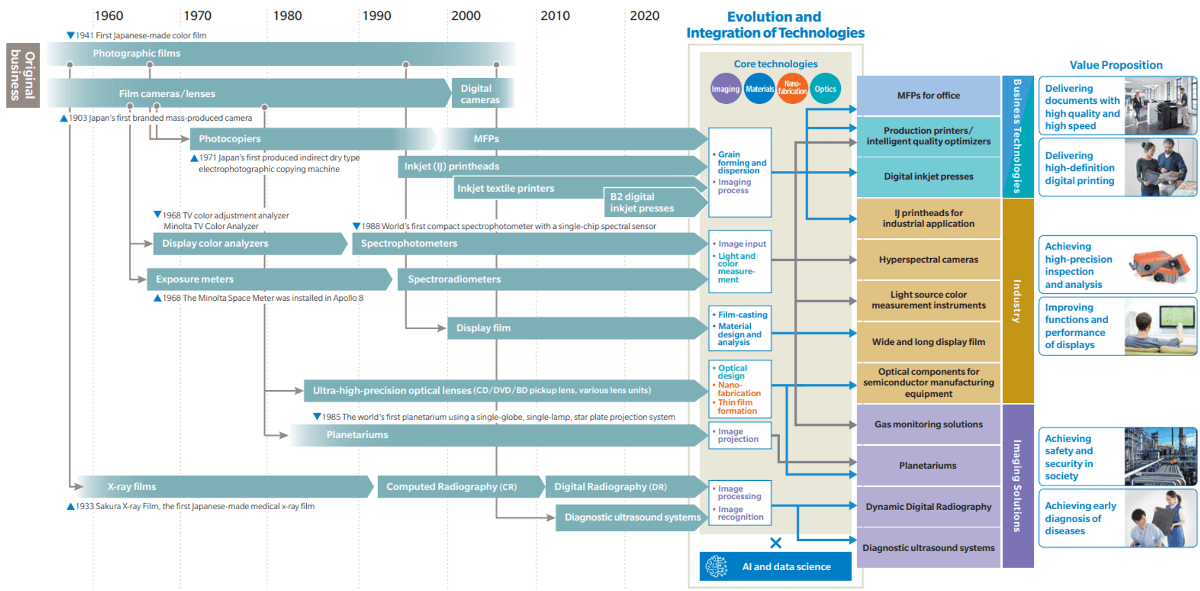
Fig. 5 Relationship between core technologies and representative products (Konica Minolta Integrated Report, 2025).
In photographic film manufacturing, coating and drying process technologies, such as the uniform dispersion of silver halide particles and film thickness control, have been developed. The knowledge obtained from these processes, including solution design, drying homogenization, and interface control, has historically contributed to the underlying technologies for organic thin-film formation and multilayer structural design. In addition, for camera optical elements, coating technologies for forming highly adherent and uniform optical thin films have been refined, and processes that balance optical performance and durability, such as anti-reflection and environmental-resistant films, were developed. Furthermore, organic and inorganic thin-film coating technologies for film and camera applications, respectively, have been integrated and expanded into lamination and sealing technologies that optimize the optical and material properties. This knowledge has been used in multilayer barrier film design, e.g. barrier-layer sealing technology for OLEDs and barrier films for improving the durability of perovskite solar cells.
Foundational technologies derived from founding businesses have evolved in response to changes in the required characteristics and application domains, and have been disseminated across multiple internal business areas. Thus, technological continuity, in which the same technological principles appear in different forms across different product groups, was confirmed. The developed technology portfolio visualization method provides a comprehensive overview of technological evolution in terms of the materials, processes, and structural control. This enables the interpretation and visualization of the structural positioning and interrelationships of core technologies.
The AI-assisted technology portfolio visualization method developed in this study is expected to serve as an efficient process for organizing company-wide product groups and for objectively identifying core technologies connected to founding businesses. Furthermore, the comprehensive technological overview clarifies the cross-cutting applicability and repurposing potential. The proposed process provides an intellectual foundation that directly supports the exploration of new application domains and the creation of new R&D themes beyond the scope of existing business domains.
We have not completed technology portfolio visualization for all products or conducted quantitative evaluations of exhaustiveness, accuracy, or reproducibility. Hence, future studies will expand the scope of the products to which the technology portfolio visualization process is applied and verify evaluation metrics.
4
Conclusion
This study developed a company-wide, cross-sectional technology portfolio visualization process based on generative AI to obtain a broad overview of Konica Minolta’s technology assets and evaluate specific products. Conventional manual technology portfolio visualization processes have a high level of expert dependency, where the analysis scope tends to be biased toward technologies/products within the expertise of relevant personnel, and are difficult to apply to a broad company-wide technology portfolio.
By contrast, the proposed technology portfolio visualization process extracts target products from a company-wide product list and combines the structural decomposition and extraction of technical information using generative AI. Within the range of product groups targeted thus far, this process was able to organize a broader target domain than conventional approaches by applying fixed rules. Therefore, the process has the potential to reduce the expert dependency and workload required to organize technological information.
Furthermore, by integrating the technology information extracted from company-wide data by generative AI and validated by expert interviews, we showed that it is possible to objectively and structurally understand technologies at the product-component level while identifying common technology domains across multiple businesses from a cross-sectional perspective. In particular, the method enabled the visualization of technological continuity; it was shown that foundational technologies derived from founding businesses—film-making and coating technologies—have been widely applied internally and adapted to new application domains as businesses evolved. This insight highlights important aspects of the technological culture of Konica Minolta.
However, the expert dependency, limited scope, and reproducibility have not been completely addressed. Generative AI outputs strongly depend on the model and prompts used and carry inherent risks of variability, bias, and hallucinations. The expert validation and correction steps included in our process can suppress these influences, but we have not yet established a method to evaluate coverage quantitatively by explicitly defining a ground-truth set for exhaustiveness, extraction accuracy, and reproducibility. These issues will be addressed in future research.
The AI-assisted technology portfolio visualization process developed in this study contributes to ongoing technology management and promotes the creation of new themes based on existing core technologies. It is also a representative example of a digital transformation that balances productivity and creativity in R&D. It is necessary to enhance the effectiveness of this process, while appropriately controlling challenges specific to generative AI by introducing model/prompt version control, output quality evaluation metrics, and the quantitative evaluation of exhaustiveness for selected product groups.
Technology inventories using generative AI are expected to evolve beyond mere efficiency measures into an intellectual foundation that contributes to the sustainable enhancement of corporate value by enabling companies to re-comprehensively examine the continuity and uniqueness of their technologies and identify new applications and seeds of growth.