1
Overview
Konica Minolta places importance on customer engagement in B-to-B businesses. However, single indicators such as the Net Promoter Score (NPS)1) and satisfaction surveys have limitations and cannot sufficiently measure customer engagement. Therefore, we have developed a new measurement method tailored to our diverse business characteristics (Fig. 1).
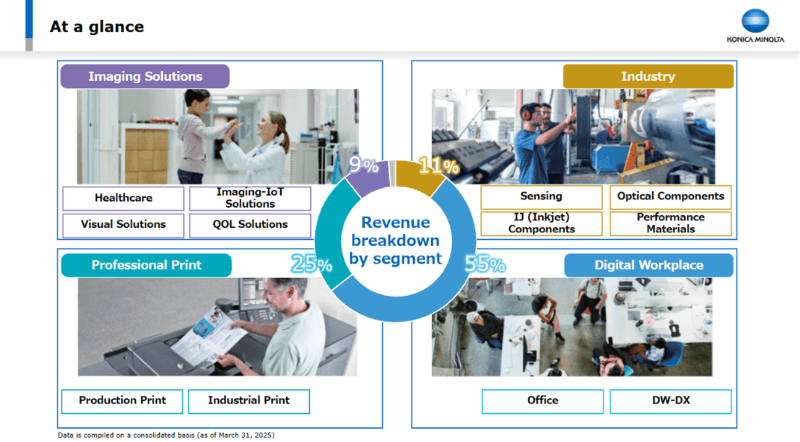
Fig. 1 Business portfolio of Konica Minolta
This method comprises three core elements. First, the customer relationship is quantified on a five-point scale, and gaps between Konica Minolta’s predicted scores and customers’ actual scores are identified. Second, customer impressions of Konica Minolta are measured across eight dimensions to analyze strengths and weaknesses. Third, stakeholder satisfaction is evaluated at each stage of the customer journey. By comprehensively analyzing these elements, we can identify experiences that require improvement and areas that should be strengthened. In addition, survey items can be flexibly customized according to industry and business characteristics. This framework enables us to derive highly reliable insights from stakeholder feedback.
2
Details
■Configuration
Engagement monitoring is a method for measuring and analyzing the two-way relationship between Konica Minolta and its customers. It consists of three components:
(1) quantifying the relationship by scoring the relationship between Konica Minolta and customers (stakeholders); (2) impression analysis by scoring eight impression factors that affect customer engagement; and (3) customer journey evaluation by scoring stakeholder satisfaction at each stage of the customer journey (Fig. 2).
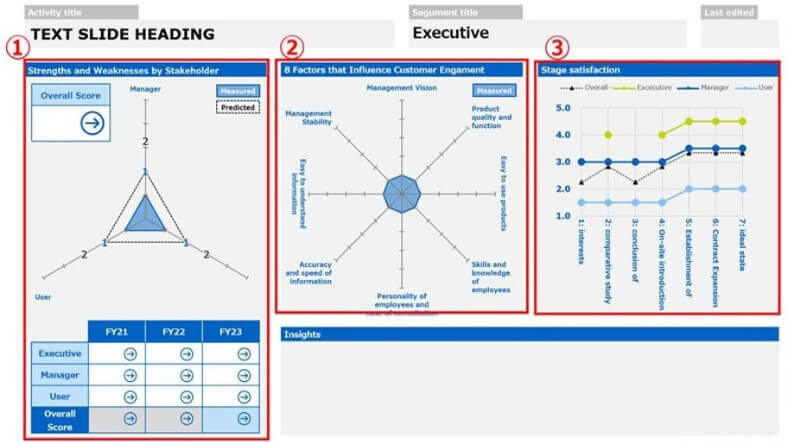
Fig. 2 Engagement monitoring
■Functions / Features / Applications
The three components of engagement monitoring are illustrated below.
(1) Quantifying the relationship: Scoring the relationship between Konica Minolta and its customers (stakeholders) (Fig. 3)
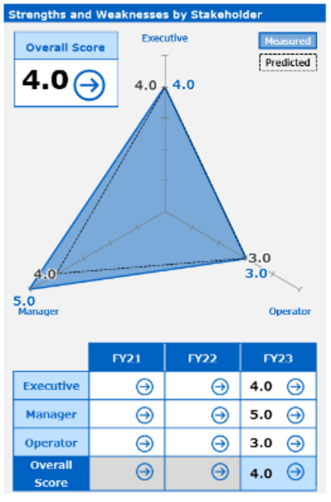
Fig. 3 Relationship by stakeholder group
Measurement: Using the questions shown in Fig. 4, we obtain responses on a five-point scale from customer stakeholders (executives, managers, and on-site staff). In parallel, Konica Minolta also predicts and scores the expected customer responses.
Analysis: For each stakeholder group, we plot Konica Minolta’s predicted values and the customers’ actual values to identify gaps between the two. This visualizes the difference between assumptions and reality. Based on this chart, the project team can then explore underlying causes and formulate hypotheses for solutions.
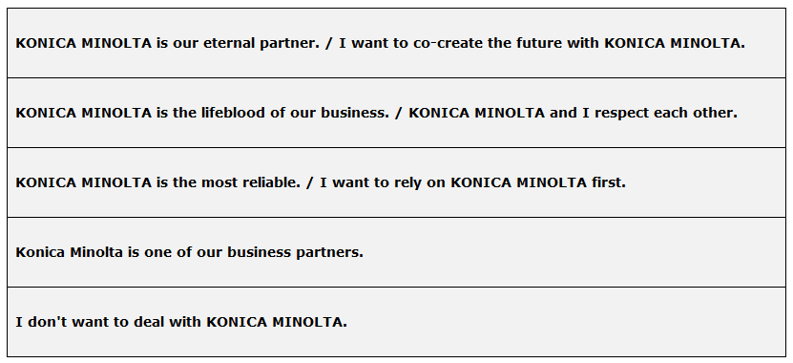
Fig. 4 Five-point scale for relationship evaluation
(2) Impression analysis: Scoring eight impression factors that affect customer engagement (Fig. 5)
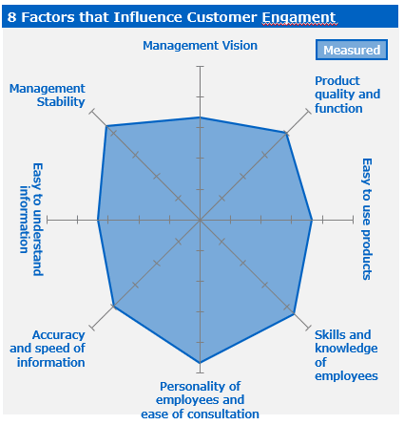
Fig. 5 Eight impression factors that affect customer engagement
Measurement: For each of the four elements—people, goods, money, and information—we obtain responses on a five-point scale across a total of eight axes covering functional and emotional aspects using the questions shown in Fig. 6.
Analysis: Scores on the eight axes are displayed in a radar chart, and the results are examined together with qualitative data to interpret strengths and weaknesses. Typically, the four elements (people, goods, money, and information) are analyzed only in terms of functional aspects, or functional and emotional aspects are scored without distinction, which can make problem identification difficult. In this method, the functional and emotional aspects of the four elements are deliberately separated and visualized, thereby improving the accuracy of problem identification.
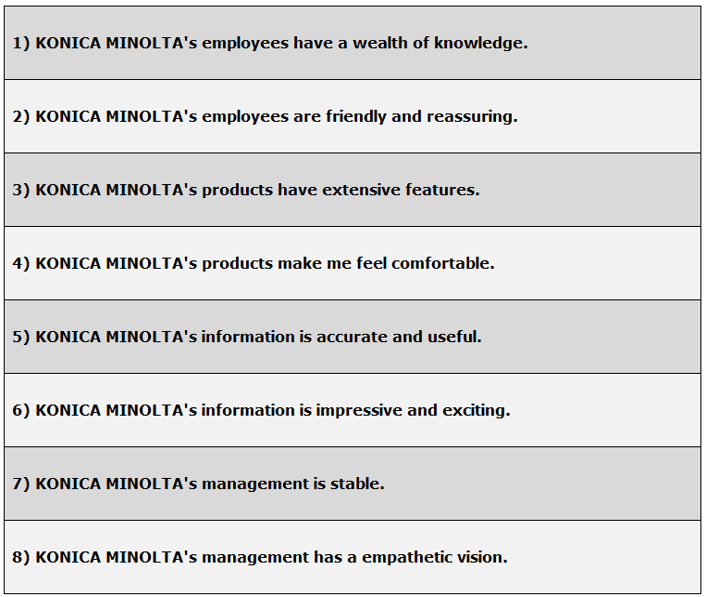
Fig. 6 Evaluation axes for the eight impression factors
(3) Customer journey evaluation: Scoring stakeholder satisfaction at each stage of the customer journey (Fig. 7)
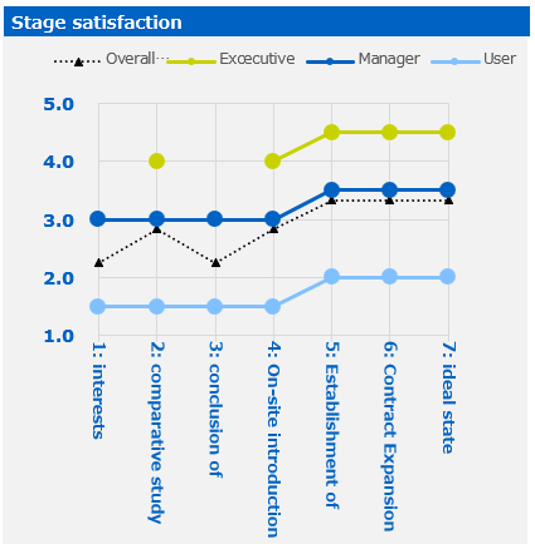
Fig. 7 Satisfaction by stage
Measurement: The customer lifecycle is divided into several key stages: interest/attention, comparison/consideration, contract signing, implementation, start of operation, operational stabilization, and contract expansion (upsell). For each stage, we obtain five-point satisfaction ratings by stakeholder group.
Analysis: By visualizing stakeholder satisfaction at each stage of the journey, we can identify which stakeholder group, individual, stage, and issue cause dissatisfaction. This helps translate improvement measures into actionable steps at the operational level.
■Future outlook
We developed and published a tool guide and instructional videos. This ensures that this method can be readily used throughout the company. Moving forward, we will promote its adoption across a wider range of businesses and further improve analytical efficiency. In addition, we will explore secondary analyses that integrate engagement data with business metrics. This will enhance both the flexibility and precision of our evaluations.