1
Introduction
Recent advances in Industry 4.0 (which supports digital technology and smart manufacturing) have resulted in the practical application of data-driven production systems (including IoT and AI) in a wide range of fields. Furthermore, Industry 5.0, which is proposed as the next stage, positions “human-centered”, “sustainability”, and “resilience” as the new foundations of industrial value. A major shift from the conventional efficiency-oriented production model has been ongoing. 1-3) Furthermore, efforts toward carbon neutrality and Sustainable Development Goals (SDGs) are spreading worldwide, with the reduction of environmental impact, improvement of resource efficiency, and construction of a circular economy becoming urgent issues. This has accelerated the transformation of the industrial structure.4-6)
Given this background, products are becoming increasingly sophisticated and complex in various fields. For example, the development of composite materials and new materials is progressing owing to the increasing need for weight reduction and electrification. Meanwhile, the fine component factor dependence on material properties has resulted in an increasing number of cases where the material properties cannot be evaluated adequately by conventional single-property measurements. Furthermore, the semiconductor and electronics industries have begun to emphasize the use of technologies for accurately detecting and managing quality fluctuations and fine defects as microfabrication technology evolves further. The food and pharmaceutical industries have also sought to conduct multifaceted evaluations of sensory characteristics and trace components that are difficult to evaluate by conventional ingredient analysis alone, to satisfy the diversifying consumer needs such as health, texture, flavor, and usability. Many previous studies and efforts have sought to evaluate the characteristics and quality control of such complex and highly functional products. For example, the food industry has proposed hybrid approaches that combine sensory evaluation techniques and chemical analysis 7-9) and component estimation models using AI and machine learning.10-12) The industrial materials industry has practically applied multifaceted evaluations using optical and thermophysical methods 13-15) and anomaly detection systems using big data analysis 16-18) in certain areas. However, many of these conventional methods focus on a specific component or an individual physical property. Moreover, the issues include insufficient integration of measurement data and the insufficiency of mechanisms for effectively modeling the interactions between multiple factors.
In this study, we addressed these issues using a multidimensional analysis system based on fluorescent probes called “Fluorescent Analysis with Inductive Recognition System” (FLAIRS). The aim was to verify the feasibility of a new characteristic evaluation and quality control method. A feature of FLAIRS is that it can obtain various pieces of information contained in a sample as multidimensional data. This is regardless of the specific components or physical properties. The analysis of these multidimensional data enables the comprehensive and efficient evaluation of the state of the entire sample. In this study, we used the sweetness evaluation of food, ejection property evaluation of inkjet materials, and authenticity assessment of pharmaceuticals as examples for verifying the effectiveness of FLAIRS in quality control and characteristic evaluation in each of these fields. We then demonstrated the potential for future application in the industrial field in general.
2
Experimental section
2-1. Development and measurement of the FLAIRS measurement system
In this study, we developed a system based on fluorescence analysis technology, namely, “Fluorescent Analysis with Inductive Recognition System” (FLAIRS). The purpose was to acquire and analyze data generated by the multidimensional physicochemical properties of liquid samples. The FLAIRS system consists of an excitation light source, a fluorescence response chip (FLAIRS chip), a light detection unit, and analysis software (Fig. 1). The excitation light source is a 365 nm LED. The chip is designed to uniformly irradiate the sample on the fluorescence-responsive chip with excitation light. This enabled the chemical interaction between the sample and fluorescent probe to be obtained as a fluorescent signal. The FLAIRS chip has a porous structure with multiple wells. Each well was filled with a different fluorescent molecular probe. These probes are designed to alter their structure in response to the components in the sample and their physicochemical properties so that the variations in emission intensity and color were almost continuous. This allowed for a fluorescent response that reflected the diverse physicochemical properties of the sample with high sensitivity. The measurement process involved dropping a specified amount of the sample onto the chip and leaving it to stand for a certain period of time to stabilize the fluorescent signal. The optical detection unit was then used to obtain hundreds of multidimensional data sets of fluorescent signals emitted from each well.
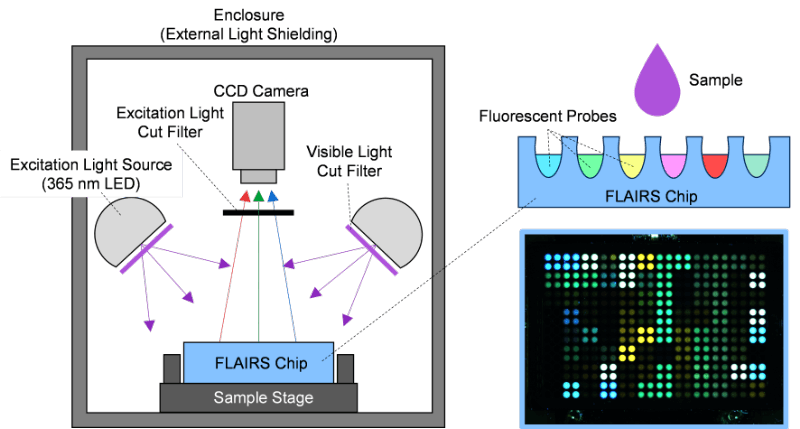
Fig. 1 Schematic of Fluorescent Analysis with Inductive Recognition System (FLAIRS). The sample is uniformly excited by a 365 nm LED light source. The chemical interactions on the fluorescence response chip are captured as fluorescence signals. The upper right shows the chip structure, whereas the lower right displays an actual measurement image of the fluorescence response chip.
2-2. Data analysis
Appropriate preprocessing was conducted on the multidimensional data obtained by FLAIRS. For the preprocessing, data were visualized using histograms and correlation matrices to understand the distribution and characteristics of each variable, and the outliers and distribution bias were verified. Subsequently, standardization (Z-score transformation) was conducted to ensure data comparability and remove scale differences between variables. Principal component analysis (PCA) was applied to the standardized data to reduce dimensionality, visualize the data structure, and identify the main factors. Partial least squares (PLS) regression was also used for regression analysis to analyze the relationship between the independent variables (FLAIRS data) and dependent variables (evaluation indices according to purpose).
2-3. Preparation and evaluation of exosome samples
We used bovine milk exosomes (product number: EXBM1000L) purchased from Cosmo Bio Co., Ltd., to visualize the damaged state of exosomes. The average exosome particle size was determined to be 200 nm using NanoSight LM10. The surface markers of exosomes (CD9, CD63, CD81) were analyzed by Western blotting, and CD9 and CD81 were verified. Meanwhile, no band for CD63 was detected (based on data provided by the distributor). The exosome sample was diluted 10-fold with 1× phosphate buffered saline (PBS). It was then dispensed into small aliquots (a total of 20 tubes) and prepared under the following storage and processing conditions (totally seven conditions). The storage conditions were generally 4 °C as recommended by the distributor. The prepared samples were stored for 17 days under four temperature conditions: 4 °C (refrigerated storage, control group), 25 °C (room temperature storage), 37 °C (physiological temperature condition), and 60 °C (high temperature stress condition). Subsequently, all the samples were stored at 4 °C for one day (18 days in total). The damage state was evaluated using the FLAIRS measurement system under the following conditions: N = 9 (60 °C only, N = 6).
For the freeze–thaw conditions, a freeze–thaw operation was defined as freezing a sample at -80 °C and then thawing it completely at room temperature. The untreated condition (zero times) involved storing the sample at 4 °C for 18 days after preparation. The 1-freeze–thaw condition involved freezing the sample at -80 °C one time and thawing it at the time of measurement. Under the 5-freeze-thaw cycle condition, the sample was frozen at -80°C, thawed at room temperature four times, and then stored again at -80°C. Before measurement, the sample was thawed once more. Under the 10-freeze-thaw cycle condition, the sample was frozen at -80°C, thawed at room temperature four times, and then stored again at -80°C. Before measurement, the sample was thawed once more. All the samples were prepared under N = 9 conditions (N = 6 only for the 60 °C condition). Moreover, each sample was measured using FLAIRS. The obtained multidimensional data were visualized using an appropriate method for visual analysis. The particle size distribution and concentration in the exosome sample were also measured using NanoSight LM10 (Malvern Panalytical) for the same samples.
2-4. Authenticity assessment of pharmaceuticals
We used FLAIRS to perform an authenticity assessment of real and counterfeit obesity treatment drug Xenical (active ingredient: orlistat 120 mg). Xenical inhibits fat absorption and is used to treat obesity and manage weight. The real and counterfeit drugs were provided by external research institutions. The counterfeit drugs were distributed in international markets. A few of these counterfeit drugs did not satisfy the standard concentration of active ingredients, and a few contained active ingredients different from those of the real drugs. Multiple lots of both real and counterfeit drugs were also provided. Each of these was considered as an independent sample and analyzed. The provided samples were received in the form of tablets, crushed in a mortar, and dissolved in a solvent (dimethyl sulfoxide: DMSO) at an appropriate concentration. The samples were dissolved and then centrifuged. The resulting supernatant was used as the measurement sample. The measurements using FLAIRS were conducted based on multidimensional data obtained from each sample. PCA was applied to the acquired data to visualize these for real and counterfeit drugs. Training was also conducted based on PCA using only the data for real drugs. A model was constructed to determine whether drugs that significantly deviated from the characteristic components were counterfeit drugs. We verified whether real drugs could be distinguished from counterfeit drugs.
2-5. Preparation and evaluation of inkjet ejection liquid
We used FLAIRS to examine the predictability of the jetting performance of polyurethane resin dispersions using an inkjet head. The samples we used were multiple polyurethane resin dispersions that were prototyped externally. These samples were based on water, and the synthetic process of the dispersed resin differed between lots. However, these were external samples. Therefore, the specific composition and blending ratio were unknown. In this study, we evaluated the ejection properties of the resin dispersion alone. It does not contain pigments or additives. The ejection test used an inkjet head manufactured in-house. It was driven at a reference voltage. Jetting performance was evaluated in collaboration with the business division, and we observed the formation behavior of the ejected droplets. The evaluation was conducted using the main axis vibration, satellite dispersion state, injection speed at air ingestion limit (AIL), and droplet formation stability as indicators. Samples with almost no main axis vibration of the droplets, negligible satellite dispersion, and no ejection failure at AIL were classified as “Good” jetting performance. Meanwhile, samples with a reduced injection speed at AIL, large amount of satellite dispersion, or unstable droplet formation were classified as “Poor” jetting performance. FLAIRS measurements were conducted on these samples. The obtained multidimensional data were preprocessed appropriately. The data were then visualized using PCA. We verified whether the difference in distribution between samples with “Good” and “Poor” jetting performance could be separated in PCA space. Additionally, we evaluated the practicality of jetting performance prediction using FLAIRS data.
2-6. Evaluation and prediction of sweetness of orange juice samples
We verified whether FLAIRS could be used to predict the effect of polysaccharides added to orange juice on the sweetness. The samples were provided by an external food manufacturer. We prepared a control sample of orange juice and test samples in which one of three types of polysaccharides (A, B, or C) was added at concentrations ranging from 0.05% to 0.3% in 0.05% increments. These samples were provided externally. Therefore, the specific type and detailed composition of the polysaccharides were not disclosed.
Sensory evaluation (quantitative descriptive analysis, QDA) was used to quantify the sweetness. This evaluation involved three panelists rating the sweetness of the reference sample (orange juice alone) as zero and evaluating the variation in sweetness owing to the addition of polysaccharides on a seven-point scale ranging from -3 (decreased significantly) to +3 (increased significantly). The evaluation was conducted using containers that did not reveal the color or appearance of the samples. Here, only the type of polysaccharides was indicated, and the concentration was concealed.
Measurements were conducted using FLAIRS for these samples. The sweetness was predicted using PLS regression after visualization by PCA using the obtained multidimensional data. PLS regression involved developing a model using the sweetness score obtained from the sensory evaluation as the objective variable and the FLAIRS data as the explanatory variable. We used cross-validation to determine the optimal number of components as three. Moreover, the data were divided into training data and test data to verify the model. The prediction performance was evaluated by plotting the relationship between the actual and predicted values. Furthermore, we integrated and analyzed the results of multiple data divisions and validation.
3
Results and discussion
3-1. Visualization of exosome damage
3-1-1. Damage caused by repeated freeze–thaw
Exosomes are small extracellular vesicles with a diameter of approximately 40–200 nm and are known to be secreted by many cells.19–21) Their main structure is surrounded by a lipid bilayer membrane. Their interior contains molecules such as proteins, nucleic acids (RNA, DNA), and lipids. Research is currently underway into applications that utilize their characteristics. In the medical field, exosomes are likely to be applied to regenerative medicine, diagnostic markers, and drug delivery systems. In the beauty field, these are attracting attention as cosmetic ingredients for promoting skin regeneration and alleviating inflammation. Their potential for application in different fields such as food, agriculture, and pet care is also expanding. Therefore, exosomes are likely to be developed in many fields as a highly advanced innovative technology. However, given their delicate structure, these sustain damage depending on the storage conditions. In this study, we used FLAIRS to visualize the damage caused by repeated freeze–thaw and the storage temperature, which strongly affect the membrane structure of exosomes.
Exosomes are generally stored at 4 °C or -80 °C to maintain their structural stability. This is because the low temperature environment suppresses the denaturation of the membrane structure and prevents the leakage and decomposition of internal components. Exosomes are more commonly frozen and stored at -80 °C owing to the need for long-term storage and transportation. Although frozen storage has the advantage of suppressing exosome deterioration, repeated freeze–thaw operations are known to cause membrane destruction, protein denaturation, and even content leakage owing to ice crystal formation and physical stress on the membrane 22–24).
These forms of damage are usually evaluated using transmission electron microscopy (TEM) and nanoparticle tracking analysis (NTA). TEM allows for the observation of the exosome morphology and membrane continuity, thereby enabling the direct detection of damage. 25,26) Meanwhile, NTA is a method for indirectly evaluating damage by measuring the variations in particle size and progression of aggregation.27,28) The measurement of particle size distribution using dynamic light scattering (DLS) and evaluation of surface charge density by zeta potential measurement are also used as indicators of exosome stability at different storage temperatures.29) However, each of these methods provides limited information, and multiple methods need to be combined for evaluation. Meanwhile, using multiple methods can complicate the measurement procedure and require high technical skills for pretreatment and device operation. This can be a technical constraint in experimental operation.
In this study, we attempted to visualize the exosome damage caused by freeze–thaw using the newly developed measurement system FLAIRS. This system can acquire the characteristics of analytes in a multidimensional manner. It can potentially be a tool that complements conventional evaluation methods. We used FLAIRS to measure exosome samples treated under multiple freeze–thaw conditions, and conducted PCA based on the obtained multidimensional data. Fig. 2 shows a scatter plot with PC1 and PC2 on the horizontal and vertical axes, respectively. The plots are colored according to the number of freeze–thaw cycles. The PCA results revealed the PC1 and PC2 contribution rates to be 33.5% and 27.5%, respectively. These two components explained 61.0% of the total variance. The plots were distributed in different regions for each number of freeze–thaw cycles, and the separation of classes according to the number of cycles was verified. In particular, the PC2 direction showed that the plots moved in a clear order with an increase in the number of freeze–thaw cycles. Samples with 0 and 1 freeze–thaw cycles had low PC2 values and plots that were relatively close together. Meanwhile, samples with 5 and 10 freeze–thaw cycles had values that were high in the PC2 direction. The values in the 10 freeze–thaw cycle condition were particularly concentrated at the highest position. That is, the PC2 direction was considered to have reflected the extent of damage caused by the freeze–thaw operation. We verified the validity of this result by measuring the particle size distribution and concentration in the exosome sample using NanoSight LM10. The results showed that as anticipated, repeated freeze–thaw cycles caused particle aggregation and an increase in the number of particles with sizes of approximately 400 nm (Fig. 3). The particle concentration also tended to decrease with an increase in the number of freeze–thaw cycles (Fig. 4). This was presumably owing to a decrease in the number of particles counted owing to aggregation and the decomposition of exosomes (which transformed to attain a structure of ≤ 80 nm that could not be measured by NanoSight LM10). The increase in particle concentration from 0 to 1 freeze–thaw cycle was considered to be owing to an increase in the number of exosomes counted as particles owing to the partial collapse of the exosomes by freeze–thaw.
Therefore, the variation in the PC2 direction was considered to be related to damage such as destabilization of the exosome membrane, aggregation, or leakage of internal components associated with an increase in the number of freeze–thaw cycles. Variations according to the number of freeze–thaw cycles were also observed in the PC1 direction. However, this effect was less significant than that in PC2. These results demonstrated that FLAIRS is an effective method for a multidimensional and quantitative evaluation of the damage state of exosomes caused by freeze–thaw procedures.
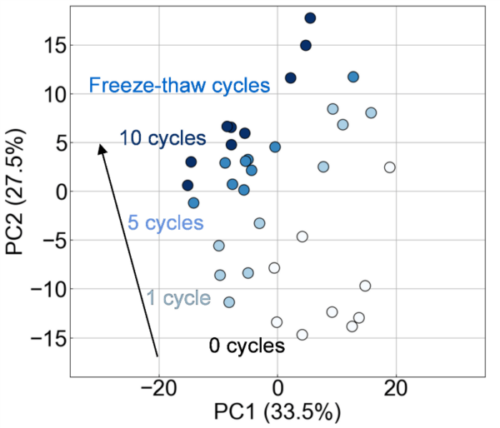
Fig. 2 PCA plot of exosome samples. The distribution along PC1 (33.5%) and PC2 (27.5%) shows class separation, with damage progression owing to the increase in freeze–thaw cycles clearly reflected along the PC2 axis.
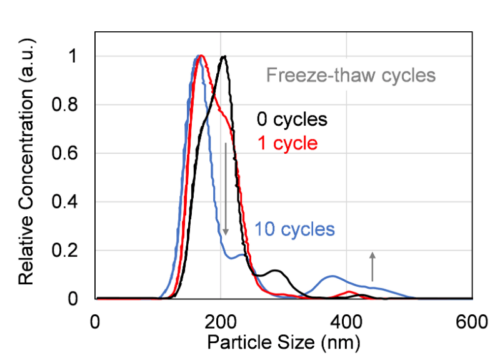
Fig. 3 Variations in exosome particle size distribution with increase in freeze–thaw cycles, measured using NanoSight LM10. Repeated freeze–thaw cycles result in particle aggregation around 400 nm, which indicates progressive structural damage to the exosomes.
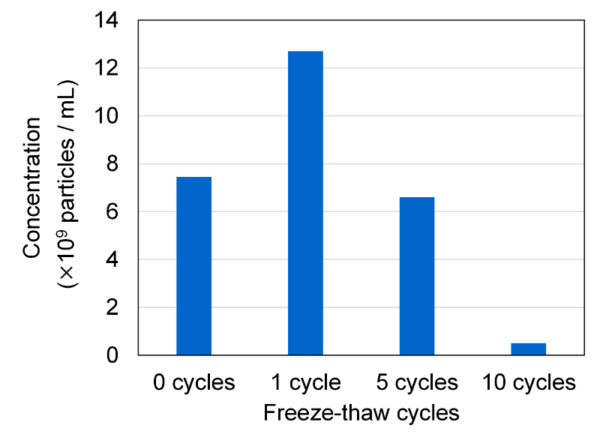
Fig. 4 Variations in exosome particle concentration with increase in freeze–thaw cycles, measured using NanoSight LM10. The particle concentration decreases with the increase in freeze–thaw cycles, which indicates advanced particle aggregation.
3-1-2. Damage owing to temperature increase during storage
Next, we examined the effect of the storage temperature on exosome damage. Research has revealed that increases in the storage temperature of exosomes resulted in an unstable membrane structure, denaturation of proteins, and an increase in the fluidity of the phospholipid bilayer. These, in turn, could result in membrane destruction, leakage of internal components, and even aggregation between exosomes 30–32).
In this study, we measured exosome samples stored under multiple temperature conditions using FLAIRS. Moreover, PCA was conducted based on the multidimensional data obtained. Scatter plots were created with PC1 and PC3 on the horizontal and vertical axes, respectively. The plots were given shades of color according to the storage temperature (Fig. 5). These results verified that the plots were clearly separated for each storage temperature and that the variations in properties were expressed in an orderly manner in the principal component space. In particular, PC1 showed a significant variation with an increase in storage temperature, and the plots tended to move continuously in the positive direction as the temperature increased from 4 °C to 60 °C. This indicates that PC1 reflected the progression of exosome damage and captured dynamic variations, particularly under high-temperature conditions. Meanwhile, PC3 exhibited a significant separation of the plots at 4 °C and 25 °C. This was considered to reflect subtle variations in exosome properties under low-temperature conditions. These results imply that PC1 indicates damage associated with large variations in storage temperature, whereas PC3 can be an indicator for identifying subtle variations under low-temperature conditions. Specifically, the separation of 4 °C and 25 °C in PC3 indicated that fine structural or chemical variations may occur on the exosome surface even in low-temperature environments. Meanwhile, the variation in the PC1 direction reflected the significant loss of structural stability of exosomes, particularly at high temperatures such as 37 °C and 60 °C.
We verified the validity of this result by measuring the particle size distribution and concentration in the exosome sample using NanoSight LM10. An increase in the number of particles of approximately 300–400 nm owing to aggregation was verified at higher temperatures. Meanwhile, no variation in size distribution was evident at lower temperatures (Fig. 6). The particle concentration also tended to increase with an increase in the number of freeze–thaw cycles (Fig. 7). This was considered to be owing to the fact that NanoSight LM10 could not measure particles of ≤ 80 nm. Therefore, when heating caused particles of ≤ 80 nm to aggregate, the concentration of particles counted increased.
These results demonstrated that the FLAIRS measurement system is capable of a multidimensional and comprehensive evaluation of the damage state of exosomes owing to the storage temperature.
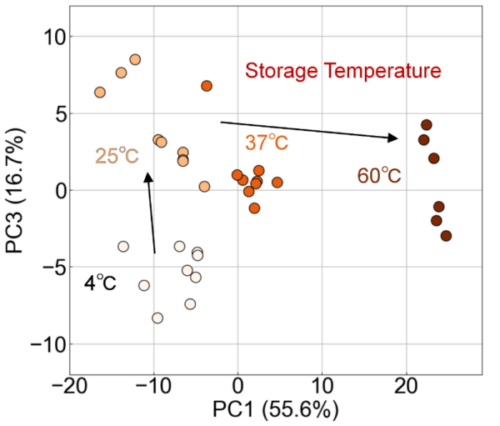
Fig. 5 Evaluation of exosome damage owing to storage temperature using PCA analysis. The scatterplot along PC1 (55.6%) and PC3 (16.7%) shows significant damage progression with the increase in temperature along the PC1 axis. Additionally, PC3 reflects subtle variations in exosome properties under low-temperature conditions (4 ℃ and 25 ℃).
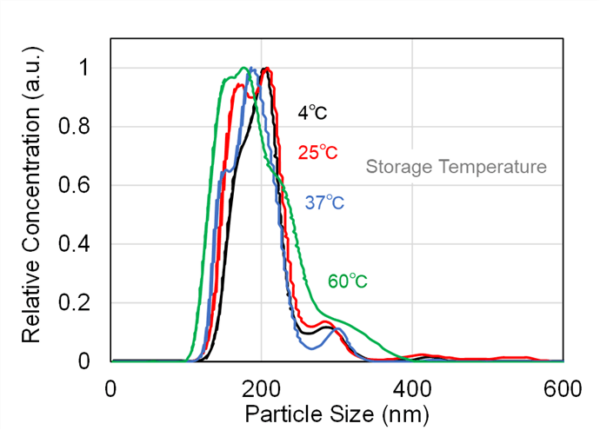
Fig. 6 Particle size distribution of exosomes stored at various temperatures (4, 25, 37, and 60 ℃), measured using NanoSight LM10. At a higher storage temperature (60 ℃), an increase in particle size around 300–400 nm was observed. This indicated aggregation. However, no significant variation in size distribution was detected at lower temperatures.
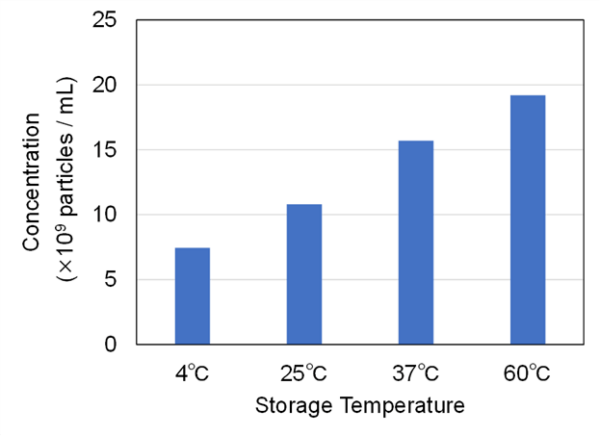
Fig. 7 Particle concentration of exosomes stored at various temperatures (4, 25, 37, and 60 ℃), measured using NanoSight LM10.
3-1-3. Separation of damage factors
The FLAIRS results indicated that the effects of the number of freeze–thaw cycles and storage temperature on exosome damage could be evaluated individually. Therefore, to determine whether these damage factors could be independently distinguished, we performed a comprehensive analysis using all experimental conditions. We applied PCA to the multidimensional data measured by FLAIRS across all conditions. The results are presented in Fig. 8. This scatter plot is a projection of the three-dimensional space composed of PC1–PC3 onto a specific plane, with Bases 1 and 2 visualized as axes. The PCA results showed that the contribution rates of PC1, PC2, and PC3 were 52.1%, 15.6%, and 9.9%, respectively. These three principal components could explain 77.6% of the total variance. Bases 1 and 2 were defined as linear combinations of these principal components and are expressed by the following equations:
Basis 1 = -0.87 × PC1 + 0.50 × PC2 + 0.05 × PC3
Basis 2 = -0.33 × PC1 – 0.49 × PC2 – 0.80 × PC3
These axes were designed to efficiently separate and reflect the effects of the storage temperature and the number of freeze–thaw cycles on the exosome characteristics. Basis 1 is an information space that mainly reflects the effect of storage temperature. Basis 2 is an information space that emphasizes the effect of the number of freeze–thaw cycles.
Fig. 8 verifies that the damage owing to storage temperature and number of freeze–thaw cycles could be identified independently in the principal component space. The effect of storage temperature is mainly reflected in the Basis 1 direction, and the plots tend to move to the left in the order of 4 °C, 25 °C, 37 °C, and 60 °C. Therefore, the results indicated that a higher temperature condition resulted in a more impaired structural stability of exosomes and further damage. Meanwhile, the effect of the number of freeze–thaw cycles was mainly reflected in the Basis 2 direction, and the plots moved upward with an increase in the number of freeze–thaw cycles. This tendency indicated that repeated freeze–thaw operations may cause various forms of damage such as the destruction of membrane structure and leakage of internal components.
The damage caused by temperature variation is considered to be mainly owing to the structural variations in membrane proteins and phospholipid bilayers, variations in surface charge, and aggregation. Meanwhile, the main effects of freeze–thaw are considered to be the collapse and aggregation of exosomes and leakage of internal components (nucleic acids and proteins). Therefore, the effects of storage temperature and number of freeze–thaw cycles on exosomes are presumed to behave differently. Conventional methods can evaluate a few of these phenomena by combining TEM, particle size measurement, zeta potential measurement, and other methods. However, the measurement range is limited, and only local information is obtained.
Our study results showed that the use of FLAIRS allowed for the independent evaluation of different damage factors (namely, the storage temperature and number of freeze–thaw cycles) in the principal component space. In particular, the Bases 1 and 2 axes were demonstrated to be effective indicators for distinguishing damage according to storage and handling conditions. This indicates the potential for FLAIRS as an effective evaluation method for optimizing exosome storage and processing conditions. This verification indicates the beginning of a new evaluation method in which the state of exosome damage (previously inferred by combining multiple advanced measurements) could be visualized with the single system, FLAIRS. A task for future study would be to verify in a test system that more realistically reflects the actual storage conditions and processing procedures, and to expand the range of application of FLAIRS. Further research is also required toward practical application, such as verifying the capability to distinguish when damage factors are intertwined with each other in a complex manner and proposing specific storage protocols based on FLAIRS measurement data.
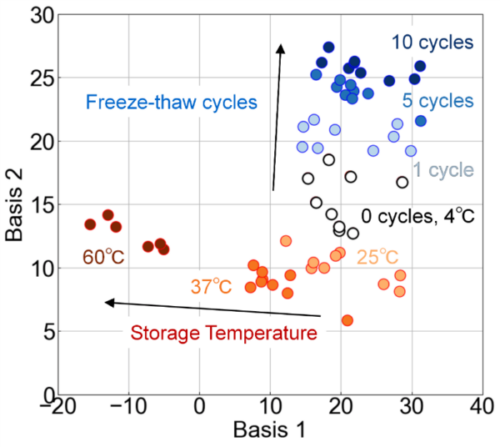
Fig. 8 Evaluation of the effects of storage temperature and freeze–thaw cycles on exosome properties using PCA analysis. Basis 1 primarily reflects the impact of storage temperature, whereas Basis 2 emphasizes the effects of freeze–thaw cycles. The storage temperature conditions (4 ℃, 25 ℃, 37 ℃, and 60 ℃) were evaluated with no freeze–thaw cycles (zero cycles), and the freeze–thaw conditions (1–10 cycles) were evaluated at a fixed temperature of 4 ℃. The plots shift to the left along Basis 1 with an increase in the storage temperature and move upward along Basis 2 with more freeze–thaw cycles. This demonstrates that these factors can be identified independently in the principal component space.
3-2. Authenticity assessment of pharmaceuticals
3-2-1. Basic evaluation of FLAIRS in authenticity assessment of pharmaceuticals
The problem of counterfeit drugs is a severe issue, particularly in the international market.33–35) These cause health problems for patients owing to the absence or insufficient concentration of active ingredients or the inclusion of impurities. Furthermore, these undermine the reliability of real pharmaceuticals. In this study, we attempted to conduct an authenticity assessment of real and counterfeit drugs using Xenical (active ingredient: orlistat 120 mg). It is an obesity treatment drug. Xenical inhibits the digestive enzyme lipase and suppresses fat absorption. It is widely used for weight management.
High-performance liquid chromatography (HPLC) and Raman spectroscopy are currently used to determine the authenticity of pharmaceuticals.36–39) HPLC is a method for analyzing impurity profiles. It is remarkable at separating and quantifying specific components. However, it cannot effectively distinguish between products with different profiles. Meanwhile, Raman spectroscopy can analyze the chemical structure of substances nondestructively. It is particularly suitable for surface analysis of pharmaceutical tablets. However, this method incurs high equipment costs and requires specialized data analysis skills. Moreover, it cannot effectively identify counterfeit drugs that contain similar ingredients. The effectiveness of this method may decrease particularly when counterfeit manufacturers adjust the ingredients to evade Raman spectroscopy-based testing. FLAIRS is a method that uses multiple fluorescent probes to obtain comprehensive physicochemical information of a sample. The obtained data does not depend on a specific physical quantity and is not interpretable by itself. Therefore, it can potentially overcome the challenges encountered by existing methods. In this study, we verified the effectiveness of FLAIRS in authenticity assessment.
Fig. 9 shows the results of visualizing the data obtained by FLAIRS using PCA. The contribution rates of PC1 and PC2 were 50.0% and 30.0%, respectively. These two principal components explained 80.0% of the total data. The PCA plot shows that the real and counterfeit drugs were clearly separated. This indicates that FLAIRS could detect the characteristic differences between real and counterfeit drugs. The counterfeit drug data also showed a distribution different from that of the real drugs, and variation existed between counterfeit drugs. This is considered to reflect the differences in the manufacturing processes and ingredient composition for each counterfeit drug.
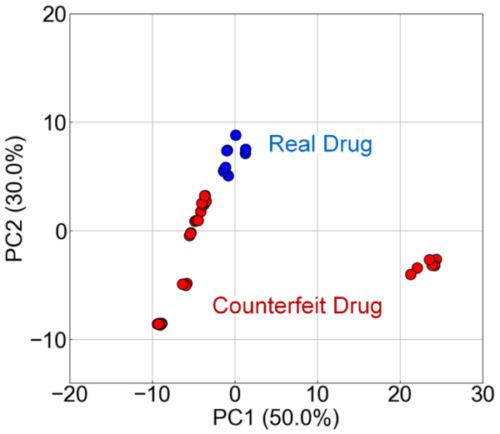
Fig. 9 PCA analysis of real and counterfeit drugs using FLAIRS. The scatter plot along PC1 (50.0%) and PC2 (30.0%) demonstrates a clear separation between real drugs (Real Drug) and counterfeit drugs (Counterfeit Drug). This indicates the high accuracy of FLAIRS in detecting characteristic differences. The variation in counterfeit drug distribution reflects the differences in manufacturing processes and compositions among the samples.
3-2-2. Development of model for distinguishing real and counterfeit drugs and verifying the performance
Next, we developed a model for distinguishing real and counterfeit drugs based on the data obtained using FLAIRS. First, we used 54 real drug samples as training data and applied PCA to these. The number of principal components was optimized in the range where the cumulative contribution rate attained 80–90%. The reconstruction loss was calculated based on the obtained principal component scores. This reconstruction loss is an indicator that reveals the extent to which the sample characteristics are reproduced by the model using PCA. A low loss value is anticipated for real drug data. Meanwhile, counterfeit drugs statistically deviate from the characteristics of real drugs, wherefore the reconstruction loss value is likely to be high. We fitted the reconstruction loss distribution of the real drug data to a gamma distribution and set a threshold indicating a normal range based on that distribution.
The validation data comprised data of 6 real drug samples and 12 counterfeit drug samples excluded from the training data. We calculated the reconstruction loss for each piece of data and compared it with the set threshold. Herein, we verified that the reconstruction loss for real drugs was within the normal range and that for counterfeit drugs exceeded the threshold (Fig. 10). This result indicated that counterfeit drugs deviated from the characteristics of real drugs, thereby implying the effectiveness of the multidimensional data obtained by FLAIRS in distinguishing real and counterfeit drugs.
We used these results as a basis to evaluate the accuracy of the authenticity assessment using a confusion matrix. Herein, we demonstrated that the real and counterfeit drugs were separated completely, with no verified misidentifications (Fig. 11). Specifically, all the 6 real drug samples were identified correctly as “real drug”, and all the 12 counterfeit drug samples were identified as “counterfeit drug”. This revealed that FLAIRS could detect marginal differences between real and counterfeit drugs with a high accuracy.
In this study, we set the threshold based on the distribution of the reconstruction loss for real drugs. However, in actual anomaly detection situations, the balance between false positives and false negatives can be controlled in a flexible manner by adjusting the threshold according to the purpose at hand. For example, the threshold can be stringently set to reduce false negatives (risk of overlooking anomalies) or relaxed to suppress false positives (risk of incorrectly determining a normal product as abnormal).
FLAIRS is also characterized by its applicability to assess whether a drug is real or counterfeit and to detect unknown anomalies in manufactured products. Conventional anomaly detection techniques are limited in that these can detect only anomalies within preset criteria or target ranges owing to their reliance on component analysis and specific physical quantities. The detection performance may also decrease when products are adjusted to circumvent specific standards or when abnormalities beyond those of conventional assumptions occur. Meanwhile, FLAIRS uses fluorescent probes to obtain multidimensional and comprehensive data of samples. Consequently, it displays a high detection performance even without predicting the type of abnormality or its cause in advance.
This method is particularly effective for identifying a wide range of abnormalities, such as unforeseen component contamination, variations in physical properties, process malfunctions, or product deterioration in the manufacturing process. The data obtained by FLAIRS are analyzed based on statistical characteristics. Therefore, circumventing the method by adjusting the components or modifying the profile is difficult. Additionally, the method can capture minute abnormalities and unknown abnormalities that are difficult to detect with conventional technologies.
The above-mentioned results showed that FLAIRS is an effective tool that could be applied flexibly to pharmaceutical quality control and counterfeit drug detection and to the fields of quality assurance and abnormality detection of general products. The method has high practicality that can complement or replace conventional technologies. It is likely to be applied to quality control and abnormality monitoring in various manufacturing industries in the future.
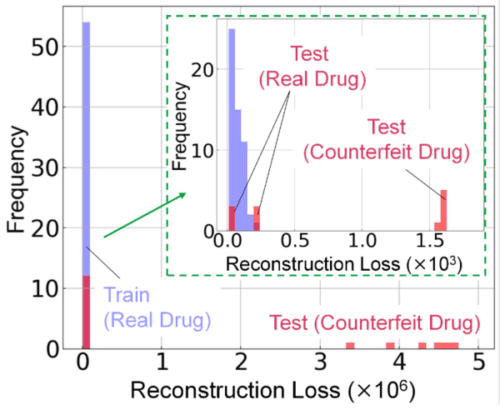
Fig. 10 Histogram showing the reconstruction loss distribution for real and counterfeit drug data. The reconstruction loss for real drugs falls within the normal range, whereas counterfeit drugs exhibit losses exceeding the threshold. The inset (green box) highlights details of the low-loss region, thereby demonstrating the capability to distinguish between real and counterfeit drugs.
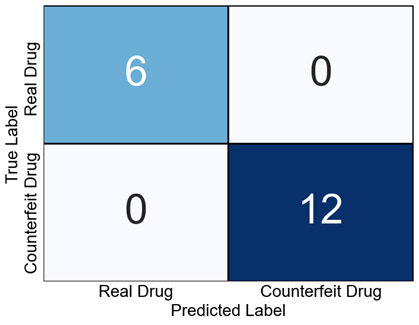
Fig. 11 Confusion matrix showing the classification results for real and counterfeit drugs. All the real and counterfeit drugs were classified correctly with no misclassifications. This demonstrates the high accuracy of FLAIRS in authentication.
3-3. Prediction of ink-jetting performance
The jetting performance in inkjet systems is influenced by various physicochemical properties of inkjet materials, such as viscosity, surface tension, and dispersion stability. Therefore, it is difficult to accurately predict the ejection behavior using a single physical property value.40–42) Conventionally, tests using an actual inkjet head are essential for evaluating jetting performance. However, this requires a large amount of time and effort, which reduces the development efficiency.
In this study, we examined the prediction of ink-jetting performance of resin dispersions using FLAIRS. An ejection test was conducted using an inkjet head on externally produced resin dispersions. The jetting performance was classified into “Good” and “Poor” based on the droplet formation behavior. We performed FLAIRS measurements on these samples, used PCA to preprocess, and visualized the obtained multidimensional data. Fig. 12 shows the results of plotting samples with jetting performance “Good” (○) and “Poor” (×) on Bases 1 and 2 planes defined based on the obtained principal components. Bases 1 and 2 were defined by linearly combining these principal components in the following equations:
Basis 1 = -0.24 × PC1 – 0.66 × PC2 + 0.71 × PC3
Basis 2 = -0.28 × PC1 + 0.66 × PC2 – 0.70 × PC3
These results suggest that samples with jetting performance rated as ‘Good’ tend to fall within a specific region. Additionally, it indicated that the droplet formation behavior outside of this range may become unstable. The separation in statistical space by FLAIRS reflected the complex physical property information related to jetting performance. We demonstrated that differences that could not be captured by a single physical property index (e.g., viscosity) could be visualized comprehensively. Furthermore, although PCA is unsupervised learning, the addition of the jetting performance evaluation results enabled clear distinctions in statistical space. This method can potentially enable FLAIRS to contribute to the efficiency of jetting performance prediction and sample evaluation.
Furthermore, the statistical method using FLAIRS is effective even for samples whose detailed composition is unknown. Moreover, it has the advantage of being capable of rapidly evaluating differences in ejection properties between samples. This indicates that the method can reduce the effort required for conventional ejection tests and can be effective as a screening tool in the early stages of development. Furthermore, many factors influence the ejection properties. Therefore, the multidimensional analysis of FLAIRS is considered to be applicable to the evaluation of the ejection properties, detection of abnormalities, and optimization of samples. These results show that FLAIRS is an effective tool that complements or replaces conventional tests in the evaluation of the ejection properties of inkjet materials and supports an efficient development process. The results also indicated that FLAIRS may be effective for understanding complex physical properties and detecting abnormalities in inkjet materials and in other product fields where the mixture of raw materials and the properties of composite materials significantly influence the product performance (such as in the cosmetic, food, paint, and adhesive industrial fields).
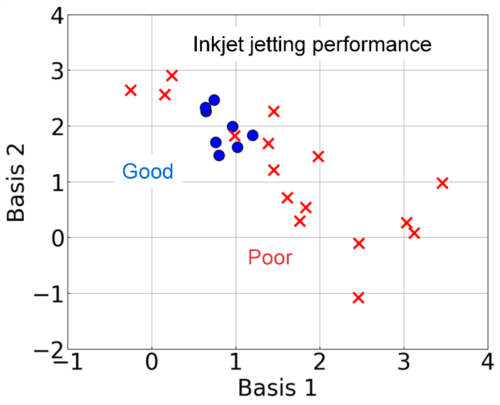
Fig. 12 Evaluation of inkjet material jetting performance using FLAIRS. In the statistical space of Bases 1 and 2, samples classified as “Good (○)” and “Poor (×)” are clearly separated. The “Good” samples are concentrated in regions with low basis values, whereas the “Poor” samples are distributed in regions with high basis values. These observations indicate that FLAIRS effectively captures the differences in physicochemical properties related to the jetting performance and distinguishes between samples statistically.
3-4. Prediction of variations in sweetness of orange juice owing to addition of polysaccharides
Currently, trace amounts of polysaccharides are frequently added to many beverage products to improve the mouthfeel and adjust the texture.43–45) Polysaccharides have almost zero sweetness. However, these are known to influence the sweetness derived from sugars contained in beverages. Moreover, these induce a secondary effect of altering the manner in which the taste is perceived by enhancing or masking the sweetness. Such variations in sweetness cannot be captured by physical measurements such as conventional saccharometers and ultimately results in the issue of our dependence on sensory evaluations. In this study, we verified whether FLAIRS could be used to quantitatively predict the effect of adding polysaccharides on the sweetness.
We conducted PCA based on the FLAIRS data to visualize the distribution and grouping of samples. Fig. 13 shows the PCA results. PC1 and PC2 explained 56.4% and 22.8% of the total variance, respectively. Samples without added polysaccharides (No Additives) were clearly distinguished from samples containing polysaccharides. Furthermore, samples containing polysaccharides were also separated into three clusters: polysaccharides A, B, and C. The clear separation indicates that FLAIRS accurately captured the spectral differences owing to the type and concentration of polysaccharides.
Next, PLS regression was applied to the multidimensional data obtained by FLAIRS, with the sensory evaluation score as the objective variable. The model was developed using cross-validation to determine the optimal number of components (three components). The model was evaluated by dividing the data into training data and test data. Fig. 14 shows the comparison results between the actual values and predicted values. The distributions of the training data (blue) and test data (orange) were in good agreement with the ideal line (actual values = predicted values). This verified that the prediction performance of the sweetness score was high. No significant outliers were observed in the training and test data. The generalization performance of the model was also good. This implies that FLAIRS statistically reflects the variation in sweetness of orange juice owing to the addition of polysaccharides and shows a high correlation with the sensory evaluation score. The results showed that even subtle variations in sweetness that were difficult to detect using conventional physical property measurements could be evaluated comprehensively and with a high accuracy by multidimensional data analysis using FLAIRS.
Furthermore, in this verification of multiple samples with different types and concentrations of polysaccharides, the PLS regression model consistently showed high predictive performance. This indicated that FLAIRS is effective as a sweetness prediction and quality control tool. It is likely to play a role as a complementary tool to sensory evaluation, thereby enabling application to efficiency and objective quality control at the product development stage.
Given the above-mentioned results, FLAIRS is likely to be applied to the quantitative prediction of sweetness and to other sensory evaluation items such as flavor and texture in the future. It is likely to be deployed in multifaceted quality control and product optimization in the food development field.
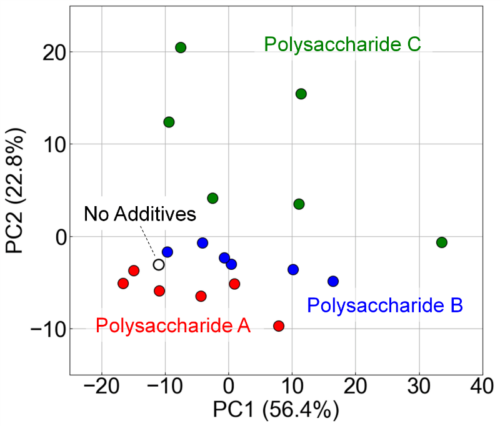
Fig. 13 Visualization of the impact of polysaccharide additives on orange juice properties using PCA analysis. Along the principal components PC1 (56.4%) and PC2 (22.8%), samples without additives (No Additives) are clearly distinguishable from those with polysaccharides. Meanwhile, samples containing polysaccharides A, B, and C form distinct clusters.
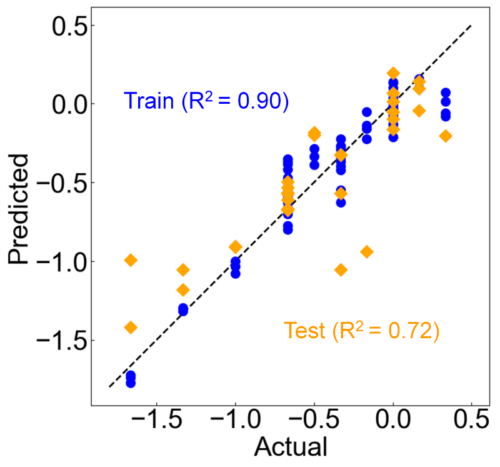
Fig. 14 Results of the PLS regression model predicting the effect of polysaccharide additives on sweetness scores. The scatterplot of actual versus predicted values shows that the training data (blue) and test data (orange) align well with the ideal line (actual = predicted). This verifies the high performance of the prediction model using FLAIRS.
4
Conclusion
In this study, we verified the effectiveness of multidimensional data analysis technology using FLAIRS in various fields including pharmaceuticals, chemical materials, and food. Furthermore, we specifically evaluated its practicality. For pharmaceuticals and chemical materials, we demonstrated that evaluations that previously required multiple advanced measurements could be replaced efficiently by multidimensional data analysis using FLAIRS. For the food field, we verified that subjective assessments that rely on sensory evaluations could be replaced with a more objective analysis. Based on these results, FLAIRS is likely to contribute to the efficient analysis of characteristics that are difficult to analyze using conventional methods, and to the efficient development of quality control and products. Furthermore, this method is likely to be applied in a wide range of industrial fields because of its versatility and flexibility.
The capability of FLAIRS to acquire multidimensional data can potentially advance beyond conventional “measurement”. It is likely to become a “data-driven platform technology” that would enhance the future of industry and society. For example, in the environmental field, this method can contribute to the development of renewable materials and the efficiency of recycling technology. In the medical field, the method can contribute to personalized medicine and the formation of new diagnostic standards, as well as the standardization of multifaceted quality evaluation in the food industry. These applications would play an important role in the highly advanced industrial model that would result in the transition from Industry 4.0 to Industry 5.0.
However, issues remain with FLAIRS that need to be resolved before its practical use. The effectiveness of the measurement device and further refinements in the analysis algorithm in particular need to be addressed. The optimization of the measurement conditions and specialized knowledge in the data analysis process continue to be necessary. The development of an interface and automation technology that can be applied conveniently by non-experts would be key to its promotion and dissemination. Further research is also required to improve the interpretability of the acquired data and the generalization performance of the model. Here, the accumulation of basic data for the development of new application fields would be a particular challenge.
Overall, FLAIRS is an innovative tool that supports efficiency in quality control and product development and enables the quantification of complex physical properties and sensory characteristics. Its range of applications is exceptionally wide. It can potentially become a core technology that supports the industrial infrastructure of the future. We consider that FLAIRS would contribute to solving social issues and to creating new value based on the results of this research.
5
Acknowledgments
We wish to express our sincere gratitude to the Society for Medicines Security Research and all related parties for their collaboration in the research and their recommendations for conducting the authenticity assessment verification using pharmaceuticals. This research was realized through the support and collaboration of all the related parties. We wish to express our sincere gratitude here.