1
Introduction
Many of Japan’s bridges were constructed during its period of high economic growth, and studies have indicated that the proportion of bridges with a lifespan over 50 years, which is generally considered to account for a majority of the bridges, will increase sharply from around 2025 (Fig. 1).1) Salt damage and neutralization cause deterioration of concrete bridges, and the corrosion of the steel inside the reinforced concrete structure results in the risk of fracture, which considerably impairs the structural performance. The leakage flux method non-destructively checks the fracture status of internal steel materials. In this study, we propose a method for automatically judging whether steel materials are fractured based on the leakage flux method.
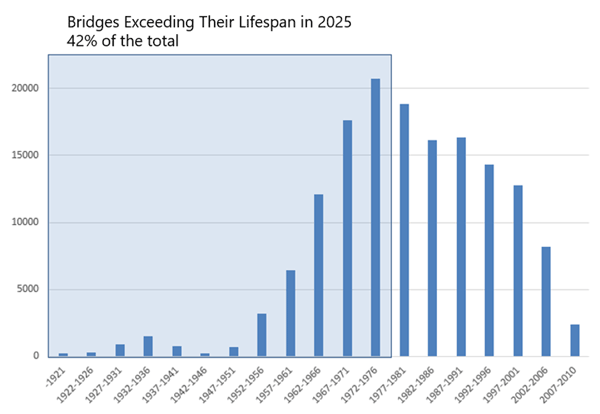
Fig. 1 Number of bridges in Japan (year of construction)
2
Experimental section
2-1. Overview of technology to detect internal steel fractures in PC steel
SenrigaN is a non-destructive sensing technology that uses magnetic and IoT technologies. It aims to develop a solution for visualizing the corrosion state and fractures of the internal steel of concrete structures in real-time, and can instantly identify the fracture location on-site by magnetic sensing and IoT-based data analysis.1) The device comprises triaxial magnetic sensors along two layers in the vertical direction, spaced 1-cm apart along the long axis and 54-cm and 4-cm apart along the short axis across 16 cm (Fig. 2). We used this device to measure the surface magnetic flux density distribution. This device has two built-in methods, the leakage flux method and magnetic stream method; in our study, we used the leakage flux method. The measurement data were also sent to the cloud via wireless LAN, and the data could be checked immediately on the cloud.
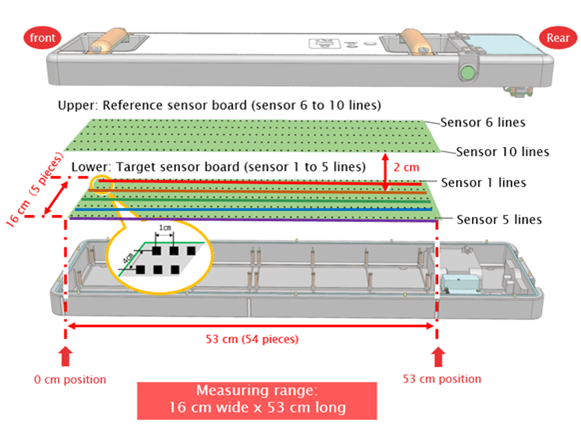
Fig. 2 Sensor layout in triaxial magnetic measurement device
The leakage flux method involves applying a magnet to the steel inside the concrete from the outside to magnetize the ferromagnetic steel (magnetization). This method measures the leakage flux from the magnetized steel and detects the presence of magnetic field changes at the fractured part. As shown in Fig. 3, the absence of fractures in the steel results in the steel becoming one magnet, and thus, the measured magnetic field changes continuously. However, the presence of a fracture in the steel results in new north and south poles being generated at the fractured part, resulting in the magnetic flux density waveform in the depth direction (Z axis) changing to an inverted S shape, and the magnetic flux density on the long side direction (X axis) changing to a convex shape. The presence and location of the fracture are determined from such changes in the magnetic flux density waveform.
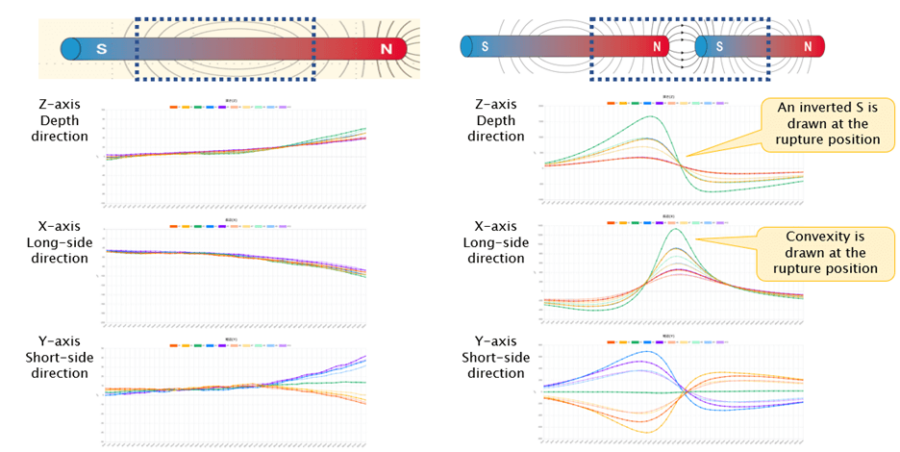
Fig. 3 Waveform of leakage flux method
2-2. Data analysis technology for leakage flux method
2-2-1. Measurement of bridges with stirrups
We explain the data analysis for the leakage flux method using model experiments. Fig. 4 shows the magnetic flux density and judgment results for cases of PC steel fracture and non-fracture. The X, Y, and Z axes are the results of measuring the magnetic flux density in the girder axis direction, direction perpendicular to the girder axis, and the girder height direction relative to the bottom of the bridge, respectively. The bridge not only has the PC steel supporting the concrete, but also stirrups arranged perpendicular to the PC steel. When the bridge is healthy, a waveform of the north pole magnetized by the stirrup component is observed, but the steel exhibits a south pole magnetization on the 0-cm side of the measurement device and a north pole magnetization on the 53-cm side, so the Z axis can capture a waveform that rises to the right. In the event of a fracture, the steel switches from north to south pole magnetization at the fracture, so the Z axis can capture a large inverted S shaped waveform, and a strong convex shape appears on the X axis.
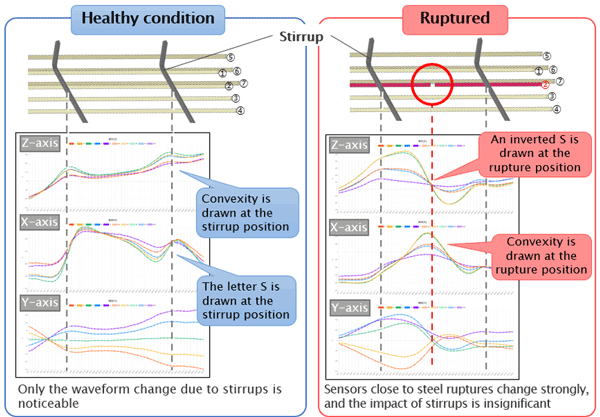
Fig. 4 Waveform of leakage flux method for PC girder
2-3. Development of steel fracture waveform automatic judgement system
We used the leakage flux method with a triaxial magnetic measurement device to develop an automatic judgement system that captures the characteristics of changes in magnetic flux waveforms when steel inside concrete fractures and judges whether a fracture has occurred. Accuracy verification was conducted using a template matching algorithm with a 2D image differentiated in two directions perpendicular to the depth-direction waveform data.
Verification was conducted using measurements of an actual PC bridge and measurement data of a steel model (Fig. 5).
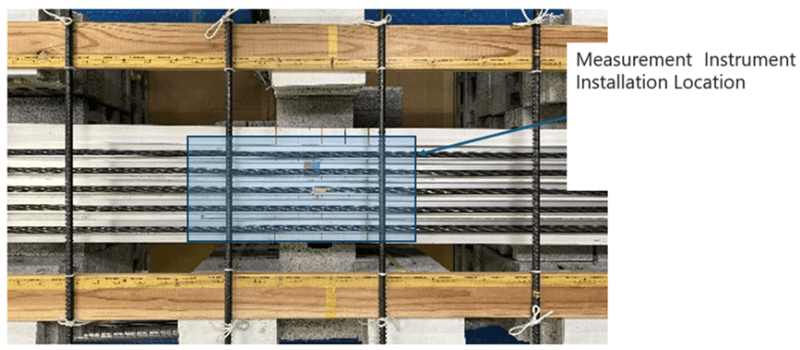
Fig. 5 Steel model
2-3-1. Development of template matching-based discrimination model
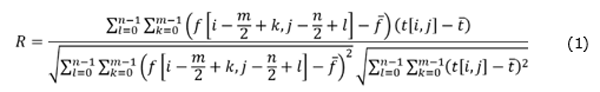
Template matching involves preparing an image called a template, and searching for the part that matches the template in the image to be diagnosed. In the example shown in Fig. 6, the similarity of an image of a template t[i,j] of size m × n (usually m < M and n < N, m and n are natural numbers) is calculated from an input image f[i,j] of size M × N (M and N are natural numbers). The similarity R is determined by calculating the correlation using Eq. (1).
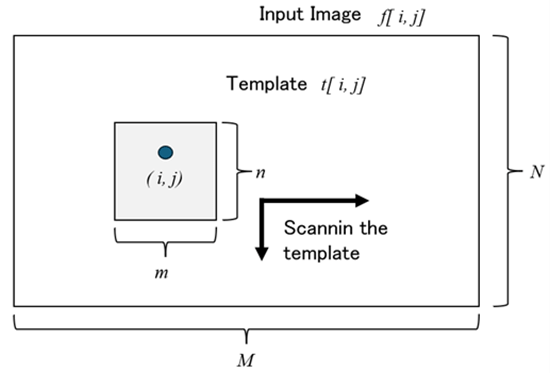
Fig. 6 Conceptual diagram of template matching process
For the waveform in the Z-axis direction, we visualized the long-axis and short-axis directions by differentiating the Z-axis component of the magnetic field captured by the sensor for each of the X-axis and Y-axis components, and creating two types of 2D images (see Fig. 7). Given that there are few sensors and the resolution is low, we conducted linear interpolation at a factor of 20. These images were normalized to 8 bits, and we generated two grayscale images for the values of dZ(z)/dx and dZ(z)/dy.
Fig. 8 shows the template image obtained by measuring the steel fracture location in the hollow member. Fig. 9 shows that the template scanned and the locations where R was determined to be ≥0.65 in the X-axis direction and ≥0.9 in the Y-axis direction as a result of a preliminary sensitivity analysis. The upper part of Fig. 9 shows the images differentiated in the long-axis direction, and the lower part in the short-axis direction. The red parts indicate that the template matches in the long-axis direction, the blue parts indicate that the template matches in the short-axis direction, and the green parts indicate that the template matches in both the long- and short-axis directions.
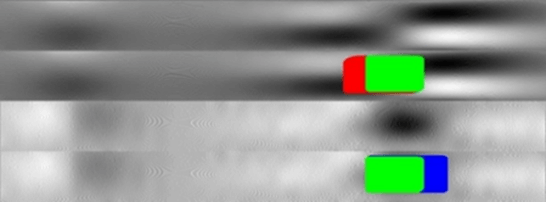
Fig. 7 Example of template matching

Fig. 8 Template of steel fracture location (enlarged view)
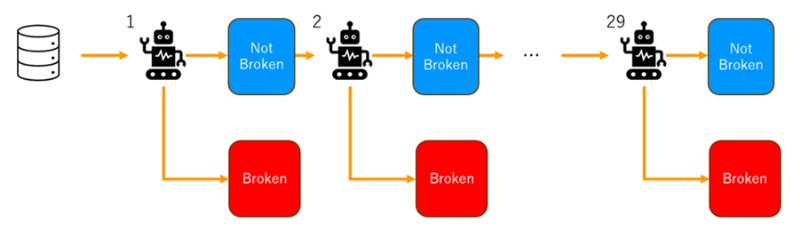
Fig. 9 Measurement using multiple templates
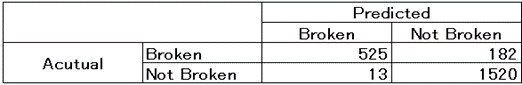
Table 1 shows the results of the fracture discrimination for the 2D images of the waveforms measured on four actual bridges using the pre-tension method, compared with the actual presence of fractures. The model accuracy rate was approximately 91%, precision rate (percentage of correct answers to number of cases predicted to have fracture) was approximately 98%, and the recall rate (percentage of cases predicted to have a fracture compared to number of cases in which fracture actually occurred) was approximately 74%.
Table 1 Results for four PC bridges
2-3-2. Optimization of thresholds for multiple templates
Results of measuring four bridges showed that the accuracy rate, which indicates the percentage of cases where a fracture is actually detected, was ≥90%, but the recall rate, which indicates the percentage of cases where a fracture is detected, was low at 74%. The number of templates was increased to 29 patterns from the false positive images. The threshold value of each template was determined so that the accuracy rate was the highest. We conducted a verification using grid search to determine the threshold value of the 29 patterns. The threshold value with the highest accuracy rate was determined for each of the 29 template patterns. As shown in Fig. 9, template matching was conducted in order of highest accuracy rate calculated using the determined threshold value. If the template matching judged the result to be a fracture, the measurement was considered to be a fracture, and if judged to not be a fracture, then subsequent template matching was conducted. The maximum accuracy rate of each template was calculated, and the threshold value was optimized using partial grid search.
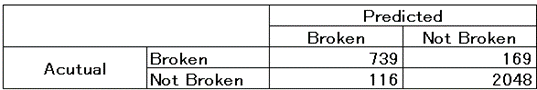
Table 2 shows the results of measurements of 14 bridges. Here, we increased the number of bridges to 14 to confirm robustness. The accuracy, precision, and recall rates were 91%, 87%, and 82%, respectively.
Table 2 Results for 14 PC bridges using 29 templates
2-4. Implementation of online application for automatic fracture judgment system
The developed automatic fracture judgment system was run in a cloud environment to build an online application that instantly uploads data measured on-site and allows users to view fracture judgment results. Fig. 10 shows the overall system architecture.
We implemented the automatic fracture judgment system as an online application using AWS-managed services in order to achieve easy operation and maintenance as a SenrigaN service and high system availability. We describe the method in this section.
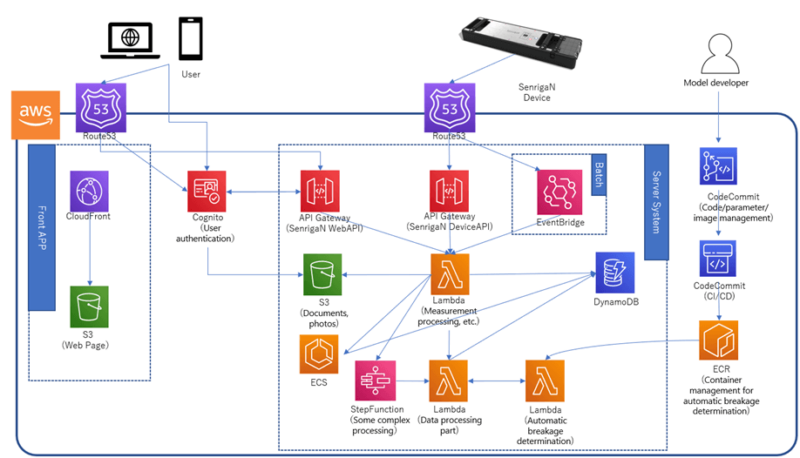
Fig. 10 Architecture of entire system
2-4-1. Containerization of automatic fracture judgment model and adoption of microservices architecture
The automatic fracture judgment model was developed using a machine learning library in Python and the above-mentioned template matching algorithm. All the environments necessary for the operation of the automatic fracture judgment model, such as these software libraries, parameters, and template images, are packaged as a container image. The use of a Docker-based containerization technology enables the treatment of the automatic fracture judgment model and its dependencies as a single independent unit, and a consistent environment can be provided at each stage of development, testing, and deployment.
The developed container image was stored in AWS’s Amazon Elastic Container Registry (ECR), deployed to AWS Lambda, and operated so that it is executed in response to requests via API Gateway. When an HTTP request is received from the API Gateway, a Lambda function is invoked, and the necessary containers are automatically started. Lambda is a serverless computing service that can execute container images. Adopting this approach enables us to achieve a flexible and highly available judgment system by running the automatic fracture judgment model as an independent container and starting the required number of containers according to the request. AWS Lambda can select and deploy any version of the container image requested in ECR; thus, managing the version of the automatic fracture judgment model and related parameters is easy, and the model can be updated and rolled back in a quick and reliable manner.
The containerized judgment model was deployed as an independent service in AWS Lambda to develop the entire system as a microservices architecture. Each component (automatic fracture judgment processing unit, measurement processing unit, data processing unit, etc.) runs as an independent service, enabling the separate development and deployment of each component, and facilitating the updating of each service. Additionally, even if a failure occurs in one service, the impact on other services can be minimized, which increases the availability and reliability of the entire system.
2-4-2. System operation and maintenance
We improved the efficiency and quality of system development by building a continuous integration / continuous delivery (CI/CD) pipeline using AWS CodePipeline. When a developer pushes changes to source code, parameters, template images, etc., to AWS CodeCommit, then CodePipeline automatically triggers the build process. AWS CodeBuild is used for the build, and after creating and testing a Docker image, the image is pushed to ECR.
After the build process is completed, then CodePipeline deploys it to AWS Lambda. The use of this method achieved a mechanism in which the system is automatically updated every time a new version of the automatic fracture judgment model code is committed to the repository. Even in cases where the performance of the judgment model needs to be improved or parameters needed to be adjusted during operation, the changes could be immediately reflected in the entire system by simply committing the changes to the repository, which facilitates the establishment of both stability and accuracy.
3
Results and discussion
We used the leakage flux method with a triaxial magnetic measurement device to develop an automatic discrimination technology that captures the characteristics of the change in the magnetic flux waveform when steel inside concrete fractures and judges whether a fracture occurred. This was realized using a pattern matching algorithm using a 2D image that was differentiated in two directions perpendicular to the depth data. We then improved the accuracy by optimizing the threshold value using multiple templates. We then implemented the developed automatic fracture judgment model in an online application as a microservices architecture using AWS managed services.
4
Conclusion
For SenrigaN, we developed a system to non-destructively inspect the interiors of concrete bridges to solve the social issue of aging infrastructure. Measurement data captured by SenrigaN required an experienced technician to interpret stirrups, other magnetic materials, and rust components that were present inside the concrete bridge. In this study, we captured the characteristics of fractures from the leakage flux method and automatically judged the fractures. Tasks for future studies involve building a more accurate fracture judgment system by analyzing not only the data from the leakage flux method, but also image data.
5
Acknowledgments
This study was conducted with support of the Ministry of Land, Infrastructure, Transport and Tourism’s Technology Research and Development Project for Improving Road Policy Quality “Completely non-destructive deterioration diagnosis of concrete structure by combining ultra-small infrared spectroscopic cameras and magnetic sensing” (principal investigator: Professor Shinichiro Okazaki, Kagawa University). We would like to express our gratitude here.