1
Introduction
In inkjet printers, micro droplets (satellites) other than the intended droplets (main droplets) are generated during ink jetting. Smaller satellites fail to be placed on the paper and instead form mist (Fig. 1). This misting can lead to image noise, contamination inside the printer, and nozzle adhesion, potentially causing ejection abnormalities and operational issues in existing printers.
To evaluate printhead jetting performance, DropWatcher (DW), which measures droplet velocity through stroboscopic imaging, is commonly used.1) This method primarily observes the behavior of main droplets after ink jetting. While satellite occurrence and mist behavior have been studied, 2-4) no prior research has directly quantified mist generation. Therefore, this study aims to establish a stable and quantitative evaluation method by measuring the volume of micro droplets potentially contributing to misting using DropWatcher.
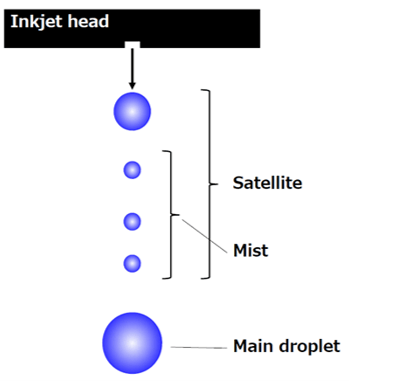
Fig. 1 Jetting stage from inkjet printheads. In inkjet printers, small droplets (satellites) that separate from the main droplet during ink jetting are generated in addition to the intended droplet (main droplet). Among these satellites, the smaller droplets are referred to as mist, which, instead of being placed on the paper, cause contamination inside the printer or adhesion to the nozzles, leading to jetting abnormalities.
2
Experimental section
2-1. Image Processing and Particle Size Distribution
The DropWatcher is a stroboscopic imaging device used to observe printhead jetting behavior, providing image data such as those shown in Fig. 2. For this study, images of 8,000 jets (8 nozzles × 1,000 images) were analyzed using a newly developed image processing program that identified all captured droplets. The program generated table data for each nozzle, including droplet count, droplet diameter, and jetting velocity. The total jet volume for each droplet size was visualized as a particle size distribution, allowing for a detailed separation between the main droplet group and the satellite droplet group.
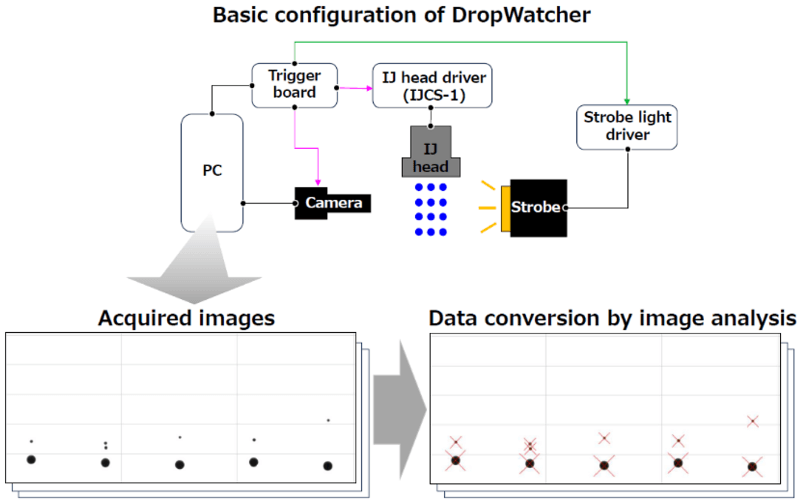
Fig. 2 Acquisition of jetting data using DropWatcher. The basic configuration of the in-house printheads jetting behavior system, incorporating the company’s head driver (IJCS-1), is shown at the top of the diagram. From the images of 8,000 jets captured though stroboscopic imaging, all droplets were identified using image processing, and the droplet information was converted into table data.
2-2. Reachable Distance
Droplets jetted from the printheads decelerate due to air resistance. The ink droplets experience a force proportional to their size, following Stokes’ law of resistance (𝐹 = 6𝜋𝜂𝑟𝑣). This deceleration can be modeled using equations of motion, as depicted in Fig. 3(A) with equations (1) and (2). Deceleration models for droplets of different sizes based on this formula are illustrated in Fig. 3.
For both main droplets and satellites, the difference in reachable distance with or without considering gravity was minimal. Therefore, a simplified reachable distance, ignoring gravity, was defined as the effective reachable distance. This distance is expressed using equation (3) in Fig. 3(A) and is determined by the initial velocity and droplet size. Smaller droplets with lower jetting velocity are more likely to form mist rather than reaching the paper.
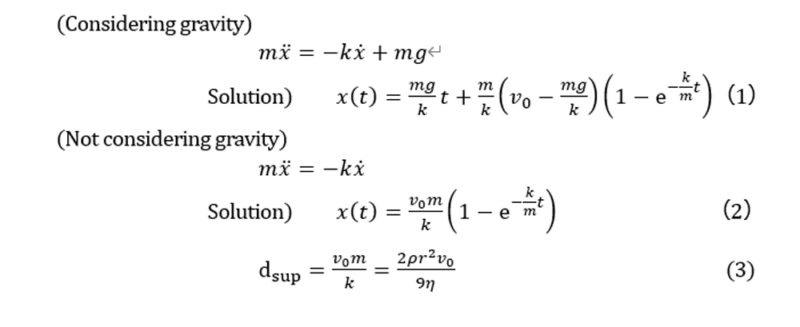
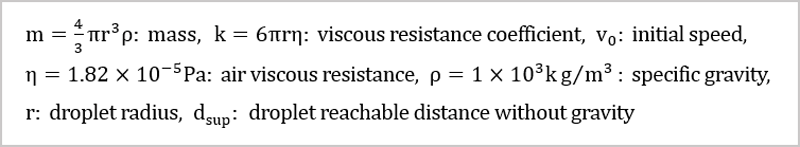
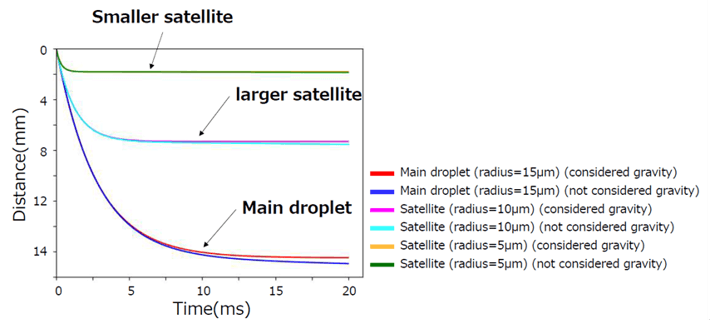
Fig. 3 Models of droplet deceleration in ink jetting. (A) Droplet deceleration model using equations of motion. Model equation (1) considers gravity, while model equation (2) ignores it. From equation (2), equation (3) for calculating the reachable distance can be derived. In this evaluation method, the influence of airflow is ignored, based on the assumption that airflow during media transport has minimal impact on whether the droplet reaches the target. (B) Flight distance by droplets of different size. The reachable distance varies depending on the droplet size, but there is minimal difference in distance between models with and without gravity consideration.
2-3. Visualization of Reachable Distance
Using this method, the reachable distance was calculated from jetting data obtained by varying the jetting voltage. By applying the initial velocity and droplet size obtained in Section 2-1, along with the calculation formula for reachable distance defined in Section 2-2 (Fig. 3(A), equation (3)), the particle size distribution was converted into either a distance frequency distribution or a cumulative distribution (Fig. 4).
From this distribution, droplets with a reachable distance shorter than the specified printing gap (the distance between the printheads and the print medium, represented by the black dotted line in Fig. 4(C)) were identified. These droplets are presumed to become airborne due to airflow and are highly likely to form mist. In this study, this droplet volume is defined as the “estimated mist volume.” This method enables the visualization of mist volume at a specified printing gap.
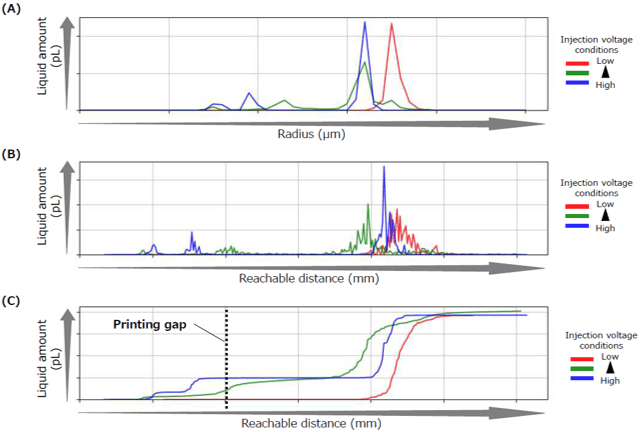
Fig. 4 Conversion from particle size to distance. (A) Histogram of particle size. As the discharge voltage (and velocity) increases, the proportion of smaller droplets increases. This is because the liquid column formed immediately after jetting becomes longer at higher speeds, leading to finer fragmentation during the flight process. (B) Distance frequency distribution. The horizontal axis was converted to distance using equation (3) from Fig. 3(A). (C) Distance cumulative distribution. The data from (B) were converted into a cumulative distribution. This allows for estimating the cumulative mist volume at a specified printing gap (distance).
3
Results and discussion
3-1. Application Example: Comparison of Drive Waveforms (Droplet Velocity)
The results of mist generation under different drive waveforms using Konica Minolta’s Printhead A are shown in Fig. 5. The horizontal axis represents the initial velocity of the droplets for each jetting condition, while the vertical axis represents the estimated mist volume that does not reach the specified printing gap. The results indicate that as the printing gap increases, the estimated mist amount also increases. Similarly, increasing voltage (and velocity) leads to higher mist volume.
By using the estimated mist amount, it is possible to analyze mist generation behavior as a function of printing gap variations, even in standalone printheads evaluations. This provides a more detailed understanding compared to traditional evaluation methods. Furthermore, these results align with actual mist dispersion measurements under continuous jetting conditions, confirming the validity of this evaluation method.
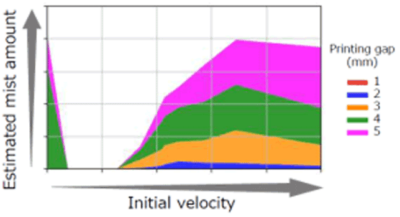
Fig. 5 Comparison of initial velocity for estimated mist amount. This graph shows the estimated mist amount with a printing gap of 1mm to 5mm. It also indicates that with a printing gap of 1mm, the estimated mist amount becomes nearly zero, the printing gap widens, and the estimated mist amount increases with higher voltage (high speed). This is due to the increased number of tiny droplets.
3-2. Application Example: Ink Type Comparison
The results of mist generation for different ink types (Ink A and Ink B manufactured by Konica Minolta) are shown in Fig. 6. The differences in mist generation between the ink types were successfully visualized. Additionally, mist dispersion measurements around the printheads under continuous jetting conditions showed similar trends, verifying the consistency of the evaluation method.
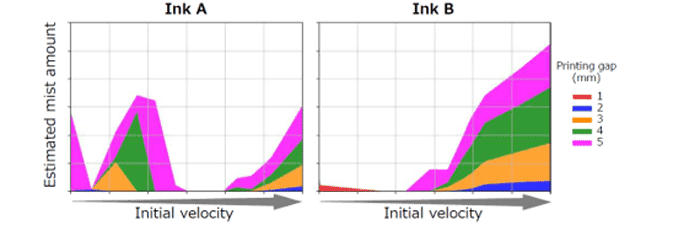
Fig. 6 Comparison of ink types for estimated amount. The graphs show the estimated mist amount of inks A and B with a printing gap of 1mm to 5mm.
3-3. Current Situation and Future Outlook
By combining particle size distribution analysis from DW image processing with droplet jetting behavior modeling through equations of motion, it has become possible to estimate mist volume—a task previously infeasible for quantitative measurement. Additionally, identifying the causes of mist generation has facilitated the development of fundamental strategies to mitigate mist-related issues.
This method is useful not only for elucidating mist generation mechanisms but also for characterizing various ink types and optimizing jetting conditions. Future applications are expected to expand. Moving forward, efforts will focus on leveraging this method for mist amount estimation across diverse jetting environments.
4
Conclusion
A novel jetting evaluation method for estimating mist generation was presented along with its results. By integrating image analysis and physical modeling with a commonly used DropWatcher, this approach provides a more detailed understanding of jetting behavior than traditional methods. Additionally, it introduces a new evaluation perspective, such as “quantitative mist evaluation,” which can be incorporated into design processes. Future research will continue exploring innovative methods to further enhance inkjet printer and printheads performance.