1
Overview
In assembly sites where manual work is predominant, continuous and accurate measurement of work time is essential for identifying bottleneck processes and factors that cause work-time variability, thereby improving productivity. However, conventional manual time measurement and aggregation are highly dependent on individual operators, impose a heavy burden on personnel in charge, and have inherent limitations for sustained improvement.
As shown in Fig. 1, the proposed system detects the start and end timing of actions using skeletal coordinates estimated from assembly-work videos and automatically estimates work time. This enables multifaceted work analysis, such as identifying bottleneck processes, analyzing work-time variability, and evaluating skill levels, without increasing additional work on the shop floor. For the work-time estimation model, we established a training scheme that does not require large amounts of annotation, thereby keeping training costs low. In addition, by leveraging MLOps technologies, coordination among processes such as video capture, annotation, training, deployment, inference, and result visualization is automated. This enables rapid provision of data useful for improvement activities while keeping on-site operation simple.
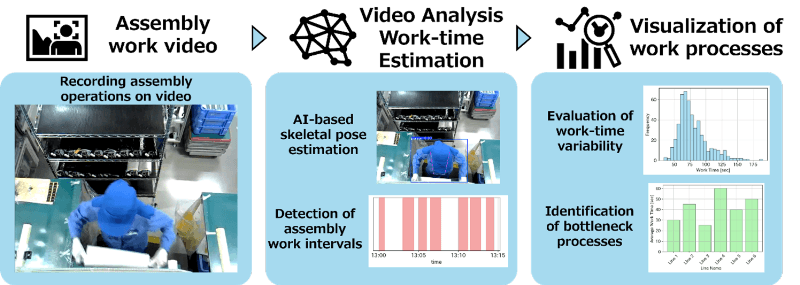
Fig. 1 Overview of the assembly work-time estimation system
2
Details
■Configuration
Figure 2 shows the configuration of the assembly work-time estimation system. The system comprises three layers: a service layer, a data layer, and a job management layer.
The service layer serves as an interface to external entities and provides various services to edge devices, analysts, and shop-floor managers. These services include video capture, video annotation, visualization of model training results, and visualization of predicted work time. The data layer manages various types of data, including captured video data, skeletal data, and annotation data. The job management layer executes jobs such as generating skeletons from video data and performing training and inference of the work-time estimation model.
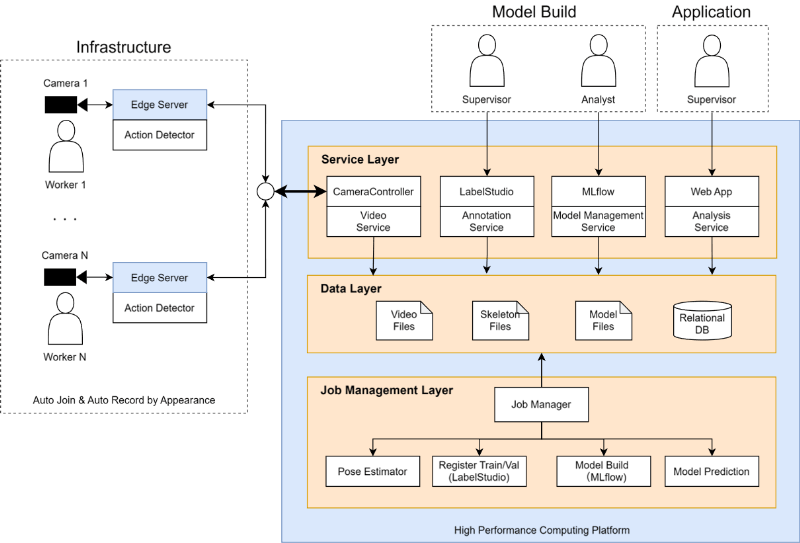
Fig. 2 System configuration diagram
■Functions / Features / Applications
1. Algorithm of the work-time estimation model
In manual assembly processes, an operator repeatedly performs a prescribed assembly operation on a unit received from an upstream process and then passes it to a downstream process. The objective of this model is to accurately estimate the time required for one such assembly cycle. An overview of the processing in the training and inference phases is provided below.
• Training phase
The model is trained using data annotated with the start and end timing of work. During training, it records skeletal time-series patterns (motifs) that appear at the start and end of each work cycle. To maximize detection accuracy for start and end timing, the combination of skeletal keypoints used and the motif length are optimized during training. Because the number of parameters to be optimized is small, the model can be trained with a limited amount of data. For optimization, we employ Bayesian optimization using Optuna’s Tree-structured Parzen Estimator1, 2), enabling efficient training.
• Inference phase
During inference, skeletal time-series data are input, and similarity to the start and end motifs is calculated at each time point to generate a similarity profile. Next, peaks in the similarity profile are detected to extract candidate positions for the start and end actions (Fig. 3).
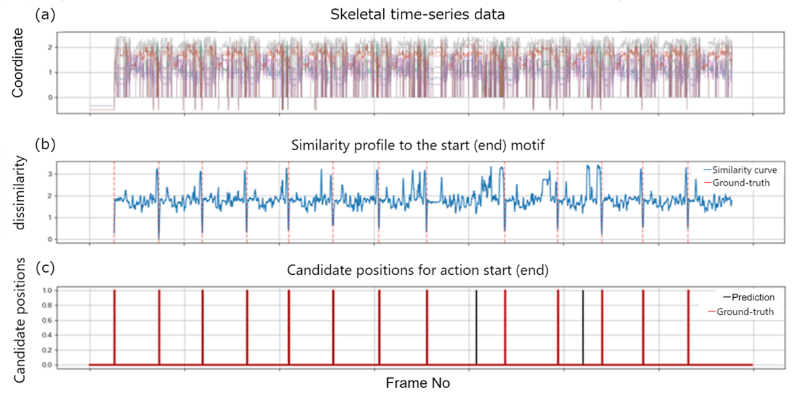
Fig.3 Schematic of extracting candidates for work start (end). (a) Example of skeletal time-series data input to the model. (b) Similarity profile to the start (end) motif at each time point. (c) Candidate positions for work start (end) obtained by detecting peaks in the similarity profile. Please note that “schematic” and “diagram” are synonyms. Hence, the use of both here is redundant.
The extracted start and end candidates are then paired, and an evaluation score is calculated for each pair. The score consists of two factors: similarity to the motifs and the degree of deviation from the standard work time (an example score table is shown in Table 1).
Table 1. Example of a score table for candidate start–end pairs

Finally, dynamic programming is used to efficiently select high-scoring pairs, which are output as assembly work intervals. The time required for assembly work is obtained from the duration of each interval (Fig. 4).

Fig.4 Result of optimal pair selection (each assembly work interval is shown as a filled region)
2. System design
2.1. Design of a model application process that can follow changes on the shop floor
Assembly sites undergo frequent changes due to 4M variation (e.g., operators and process design), making it necessary to rapidly rebuild models and reflect workflow updates when changes occur. This system accelerates shop-floor improvement activities by reducing coordination costs across processes, from video capture and annotation to model evaluation, deployment, and aggregation of inference results. Data required for each process are consolidated in the data layer, and the Job Manager automates inter-process coordination using the presence or absence of data as triggers. This allows each user to focus on their respective responsibilities.
2.2. A scalable processing platform for high-load video data
To handle high-load video data in a stable and high-speed manner, we built an infrastructure optimized from capture through analysis. By performing person detection on the edge device and capturing and transmitting only segments in which a person appears, data volume and processing load are significantly reduced. We also introduced a real-time video streaming mechanism that supports multiple cameras and transmits video to the server without delay, achieving stable, high-speed transfer even for large video datasets. On the server side, the streaming data are directly used as input, and skeletal extraction and video storage are processed in parallel to improve the efficiency of the overall analysis workflow. In addition, the architecture allows camera–edge device pairs to be added or removed dynamically, providing scalability that flexibly accommodates changes on the shop floor.
3. Results of shop-floor deployment
This section describes results obtained by applying the system to an in-house production printer assembly process. As shown in Fig. 5, a camera was fixed directly above the operator. In this process, one assembly work interval was defined as the period from receiving a unit from the table on the operator’s right to placing it on the table on the operator’s left after completing the assembly operation. The operator repeating this cycle was recorded on video.
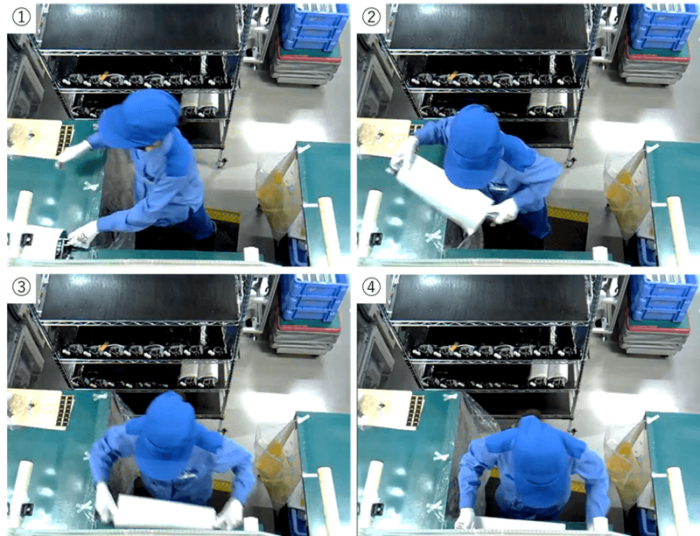
Fig.5 Example of a captured video. The sequence from receiving a unit to starting assembly work is shown in ①–④.
Figure 6 shows an example comparison between model-predicted intervals and ground-truth intervals. Except for a small number of missed detections, the predicted intervals generally agree with the ground truth. In verification using a total of 7.5 hours of video, the mean ground-truth work time was 39.2 s, whereas the mean predicted work time was 38.3 s, confirming that high-accuracy work-time estimation is possible (Table 2).
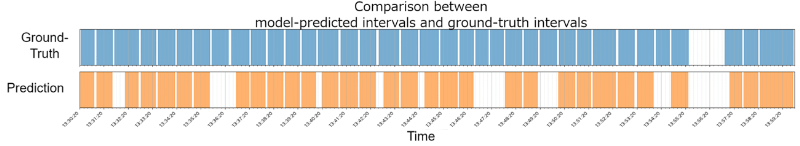
Fig.6 Example prediction results. Predicted intervals and ground-truth intervals are compared for a video recorded for 30 min of actual assembly work.
Table 2. Mean work time over the entire dataset

The prediction results can be readily reviewed using a visualization application. In the example function for displaying work-time distribution shown in Fig. 7, the distribution and statistical metrics of work time for a specified period can be obtained. Based on this information, shop-floor managers can carry out effective improvement activities, such as identifying bottleneck processes and sources of variability.
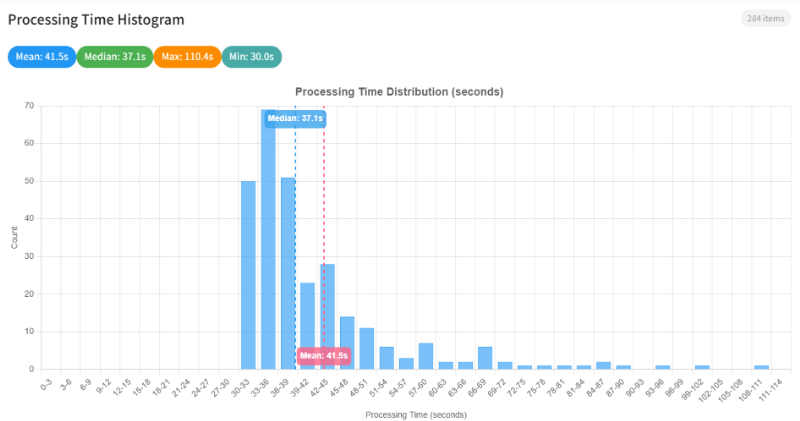
Fig. 7 Example visualization of the work-time distribution in the work visualization application
■Future outlook
The system is currently undergoing value verification at in-house manufacturing sites. Going forward, we will enhance system functions and develop improvement workflows to establish a mechanism that enables rapid and continuous improvement cycles on the shop floor. We aim to evolve the system beyond work-time estimation into a solution directly linked to shop-floor improvement.